M. H. Stanley Middle School
Rating
Not Available
Not Available

5 out of 5 | 1 Review
Find Old Friends From M. H. Stanley Middle School
Use the form below to search for alumni from M. H. Stanley Middle School.
School Description
School Summary and Highlights
- Enrolls 1,123 middle school students from grades 6-8
- Ranks 58th out of 2,050 middle schools in CA.
- 2010 Overall School AYP Met Status: No
Additional Contact Information
- Mailing Address: 3455 School St., Lafayette, CA 94549
School Operational Details
- Title I Eligible
School District Details
- Lafayette Elementary
- Per-Pupil Spending: $8,615
- Students Per Teacher: 19.3
- Enrolled Students: 3,205
Faculty Details and Student Enrollment
Students and Faculty
- Total Students Enrolled: 1,123
- Total Full Time "Equivalent" Teachers: 51.0
- Average Student-To-Teacher Ratio: 22.0
Students Gender Breakdown
- Males: 586 (52.2%)
- Females: 537 (47.8%)
Free Lunch Student Eligibility Breakdown
- Eligible for Reduced Lunch: 7 (0.6%)
- Eligible for Free Lunch: 30 (2.7%)
- Eligible for Either Reduced or Free Lunch: 37 (3.3%)
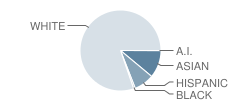
Student Enrollment Distribution by Race / Ethnicity
| Number | Percent | |
|---|---|---|
| American Indian | 1 | 0.09% |
| Black | 7 | 0.6% |
| Asian | 115 | 10.2% |
| Hispanic | 84 | 7.5% |
| White | 842 | 75.0% |
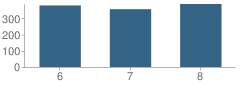
Number of Students Per Grade
| Number | Percent | |
|---|---|---|
| 6th Grade | 379 | 33.7% |
| 7th Grade | 356 | 31.7% |
| 8th Grade | 388 | 34.6% |
Teacher Education Background (2009)
Percent With Ph.D.
School:
1.6%
District:
10.5%
Percent With Master's Degree
School:
23.8%
District:
52.6%
Percent With Bachelor's Degree: 4.8%
Teacher Credentials & Experience (2009)
Percent of Teachers With Credentials: 100.0%
Number of Certificated Staff: 63.0
Average Number of Years of Teacher Experience: 15.6
Average Age
School:
46.1
District:
47.5
Source: CA Department of Education, Source: NCES 2009-2010
School Ratings and Reviews
Overall Rating: 5

5 out of 5 | 1 Review
The Overall Rating is the school's average rating from parents, students, school faculty and staff. The highest rating is five apples and the lowest is one apple.
Share Your Review About This School
1 review for M. H. Stanley Middle School
- Reviewed by Parent/Guardian on September 23, 2009
- Rating:
 (5 / 5) Flag as inappropriate
 - This school is a wonderful school to go the teachers are nice and the school
is supportive to all the students
-selina limbaugh-
School Map and Similar Schools Nearby
Click to Activate Map of Nearby School Campuses
Private
Public
This School
Similar Schools Nearby
| Glorietta Elementary School KG-7 | 470 Students | 2.9 miles away | Not Yet Rated | |
| Orinda Intermediate School 6-8 | 561 Students | 3.1 miles away | Not Yet Rated | |
| Del Rey Elementary School KG-6 | 454 Students | 3.6 miles away | Not Yet Rated | |
| Joaquin Moraga Intermediate School 6-8 | 631 Students | 4.3 miles away |  5 out of 5 | |
| Sequoia Middle School 6-8 | 842 Students | 4.7 miles away | 5 out of 5 | |
| Sleepy Hollow Elementary School KG-6 | 450 Students | 5.0 miles away | Not Yet Rated | |
| Wagner Ranch Elementary School KG-6 | 410 Students | 5.3 miles away | Not Yet Rated | |
| Stone Valley Middle School 6-8 | 689 Students | 5.5 miles away | Not Yet Rated | |
| Oak Grove Middle School 6-8 | 579 Students | 5.6 miles away | Not Yet Rated | |
| Foothill Middle School 6-8 | 1,038 Students | 5.8 miles away | Not Yet Rated | |
Compare This School To Nearby Schools ->
School Community Forum

Join a discussion about M. H. Stanley Middle School and talk to others in the community including students, parents, teachers, and administrators.
Popular Discussion Topics
- Admissions and Registration Questions (e.g. Dress Code and Discipline Policy)
- School Calendar and Upcoming Events (e.g. Graduation)
- After School Programs, Extracurricular Activities, and Athletics (e.g. Football)
- News and Announcements (e.g. Yearbook and Class Supply List Details)
- Graduate and Alumni Events (e.g. Organizing Class Reunions)
Navigation
Can't Find What You Are Looking For?
Rankings
Nearby Cities
Sponsored Links
K-12 Articles

Teaching Children a Love of History
Parents and grandparents are responsible for teaching children a love of history. To begin, relate...
Parents and grandparents are responsible for teaching children a love of history. To begin, relate...

Idle Hands
The worst affliction affecting our kids today is not teen pregnancy, drugs and alcohol, or...
The worst affliction affecting our kids today is not teen pregnancy, drugs and alcohol, or...

The Most Used Form of Communication
Writing has, quite surprisingly, become more and more important in today's electronic society....
Writing has, quite surprisingly, become more and more important in today's electronic society....