Trinidad School
Rating
Not Available
Not Available

No Reviews Yet
Find Old Friends From Trinidad School
Use the form below to search for alumni from Trinidad School.
School Description
School Summary and Highlights
- Enrolls 189 school students from grades PK-12
- Ranks 1163rd out of 1,325 high schools in TX.
- 2010 Overall School AYP Met Status: Yes
Additional Contact Information
- Mailing Address: P O Box 349, Trinidad, TX 75163
- Principal or Admin: Mr Corey Jenkins
- Fax: (903) 778-4120
- Website: www.trinidad.k12.tx.us
School Operational Details
- Title I EligibleAll students of this school are eligible for participation in authorized programs.
School District Details
- Trinidad Independent School District (ISD)
- Per-Pupil Spending: $10,687
- Graduation Rate: 86.4%
- Dropout Rate: 7.8%
- Students Per Teacher: 10.0
- Enrolled Students: 189
Faculty Details and Student Enrollment
Students and Faculty
- Total Students Enrolled: 189
- Total Full Time "Equivalent" Teachers: 18.9
- Average Student-To-Teacher Ratio: 10.0
Students Gender Breakdown
- Males: 102 (54.0%)
- Females: 87 (46.0%)
Free Lunch Student Eligibility Breakdown
- Eligible for Reduced Lunch: 16 (8.5%)
- Eligible for Free Lunch: 103 (54.5%)
- Eligible for Either Reduced or Free Lunch: 119 (63.0%)
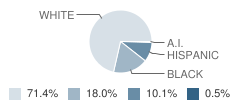
Student Enrollment Distribution by Race / Ethnicity
| Number | Percent | |
|---|---|---|
| American Indian | 1 | 0.5% |
| Black | 34 | 18.0% |
| Asian | - | - |
| Hispanic | 19 | 10.1% |
| White | 135 | 71.4% |
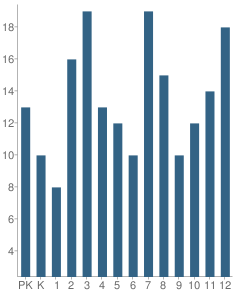
Number of Students Per Grade
| Number | Percent | |
|---|---|---|
| Pre-Kindergarten | 13 | 6.9% |
| Kindergarten | 10 | 5.3% |
| 1st Grade | 8 | 4.2% |
| 2nd Grade | 16 | 8.5% |
| 3rd Grade | 19 | 10.1% |
| 4th Grade | 13 | 6.9% |
| 5th Grade | 12 | 6.3% |
| 6th Grade | 10 | 5.3% |
| 7th Grade | 19 | 10.1% |
| 8th Grade | 15 | 7.9% |
| 9th Grade | 10 | 5.3% |
| 10th Grade | 12 | 6.3% |
| 11th Grade | 14 | 7.4% |
| 12th Grade | 18 | 9.5% |
Breakdown of College Ready Graduates (2009)
Percent Ready For College in Reading
School:
13.0%
District:
13.0%
State:
62.0%
Percent Ready For College in Math
School:
22.0%
State:
60.0%
Graduation & Dropout Rates (2009)
Graduation Rate
School:
57.9%
District:
57.9%
State:
80.6%
Dropout Rate
School:
42.1%
District:
42.1%
State:
9.4%
Faculty Breakdown (2010)
Average Teacher Experience
School:
6.4
District:
6.4
State:
11.3
Percent of Teachers With 1-5 Years Experience
School:
47.0%
District:
47.0%
State:
31.0%
Percent of Teachers With 6-10 Years Experience
School:
15.9%
District:
15.9%
State:
20.3%
Percent of Teachers With 11-20 Years Experience
School:
21.2%
District:
21.2%
State:
24.4%
Percent of Teachers With Greater Than 20 Years Experience
School:
5.3%
District:
5.3%
State:
18.3%
Faculty Salary (2010)
School Administration Average Base Salary
School:
$53,049
District:
$53,049
State:
$70,209
Teacher Average Base Salary
School:
$37,270
District:
$37,270
State:
$48,263
Beginning Teacher Average Base Salary
School:
$30,795
District:
$30,795
State:
$41,165
Teacher With 1-5 Years Experience Average Base Salary
School:
$33,330
State:
$43,527
Teacher With 6-10 Years Experience Average Base Salary
School:
$40,079
State:
$46,149
Teacher With 11-20 Years Experience Average Base Salary
School:
$44,130
State:
$50,153
Teacher With Greater Than 20 Years Experience Average Base Salary
School:
$49,290
State:
$58,427
Source: TX Department of Education, Source: NCES 2009-2010
School Ratings and Reviews
Be The First To Review Trinidad School!
School Map and Similar Schools Nearby
Click to Activate Map of Nearby School Campuses
Private
Public
This School
Similar Schools Nearby
| Malakoff High School 9-12 | 305 Students | 4.6 miles away | Not Yet Rated | |
| Kerens School PK-12 | 658 Students | 7.9 miles away | Not Yet Rated | |
| Cross Roads High School 9-12 | 187 Students | 9.4 miles away | Not Yet Rated | |
| Cross Roads Junior High School 6-8 | 132 Students | 9.4 miles away | Not Yet Rated | |
| Eustace High School 9-12 | 431 Students | 12.5 miles away |  4 out of 5 | |
| Athens High School 9-12 | 829 Students | 15.0 miles away |  5 out of 5 | |
| Mabank Middle School 7-9 | 473 Students | 16.1 miles away | 5 out of 5 | |
| Mabank High School 8-12 | 982 Students | 16.5 miles away |  3 out of 5 | |
| Kemp High School 9-12 | 498 Students | 21.9 miles away | Not Yet Rated | |
| Kemp Junior High School 7-8 | 237 Students | 22.2 miles away | 5 out of 5 | |
Compare This School To Nearby Schools ->
School Community Forum

Join a discussion about Trinidad School and talk to others in the community including students, parents, teachers, and administrators.
Popular Discussion Topics
- Admissions and Registration Questions (e.g. Dress Code and Discipline Policy)
- School Calendar and Upcoming Events (e.g. Graduation)
- After School Programs, Extracurricular Activities, and Athletics (e.g. Football)
- News and Announcements (e.g. Yearbook and Class Supply List Details)
- Graduate and Alumni Events (e.g. Organizing Class Reunions)
Navigation
Can't Find What You Are Looking For?
Nearby Cities
Sponsored Links
K-12 Articles

Siblings and Individual Identity in High School
When the first day of high school looms in the near future, teens are both excited and anxious....
When the first day of high school looms in the near future, teens are both excited and anxious....

The Most Used Form of Communication
Writing has, quite surprisingly, become more and more important in today's electronic society....
Writing has, quite surprisingly, become more and more important in today's electronic society....

Homework Tips: Taking the Work out of Homework
Kids hate homework. It seems that almost every night of the week they are overloaded with...
Kids hate homework. It seems that almost every night of the week they are overloaded with...