Thurston Middle School
Rating
Not Available
Not Available

No Reviews Yet
Find Old Friends From Thurston Middle School
Use the form below to search for alumni from Thurston Middle School.
School Description
School Summary and Highlights
- Enrolls 683 middle school students from grades 6-8
- Ranks 127th out of 2,050 middle schools in CA.
- 2010 Overall School AYP Met Status: Yes
Additional Contact Information
- Mailing Address: 2100 Park Ave., Laguna Beach, CA 92651
School Operational Details
- Title I Eligible
School District Details
- Laguna Beach Unified School District
- Per-Pupil Spending: $12,406
- Graduation Rate: 96.5%
- Students Per Teacher: 20.3
- Enrolled Students: 2,919
Faculty Details and Student Enrollment
Students and Faculty
- Total Students Enrolled: 683
- Total Full Time "Equivalent" Teachers: 31.2
- Average Student-To-Teacher Ratio: 21.9
Students Gender Breakdown
- Males: 345 (50.5%)
- Females: 338 (49.5%)
Free Lunch Student Eligibility Breakdown
- Eligible for Reduced Lunch: 17 (2.5%)
- Eligible for Free Lunch: 50 (7.3%)
- Eligible for Either Reduced or Free Lunch: 67 (9.8%)
Student Enrollment Distribution by Race / Ethnicity
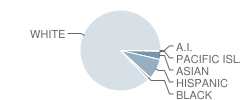
| Number | Percent | |
|---|---|---|
| American Indian | 1 | 0.1% |
| Black | 8 | 1.2% |
| Asian | 22 | 3.2% |
| Hispanic | 55 | 8.1% |
| White | 583 | 85.4% |
Number of Students Per Grade
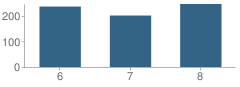
| Number | Percent | |
|---|---|---|
| 6th Grade | 236 | 34.6% |
| 7th Grade | 201 | 29.4% |
| 8th Grade | 246 | 36.0% |
Teacher Education Background (2009)
Percent With Ph.D.
School:
5.4%
District:
16.7%
Percent With Bachelor's Degree: 2.7%
Teacher Credentials & Experience (2009)
Percent of Teachers With Credentials: 100.0%
Number of Certificated Staff: 37.0
Average Number of Years of Teacher Experience: 14.1
Average Age
School:
43.5
District:
45.3
Source: CA Department of Education, Source: NCES 2009-2010
School Ratings and Reviews
Be The First To Review Thurston Middle School!
School Map and Similar Schools Nearby
Click to Activate Map of Nearby School Campuses
Private
Public
This School
Similar Schools Nearby
| Don Juan Avila Middle School 6-8 | 1,263 Students | 2.9 miles away | Not Yet Rated | |
| Aliso Viejo Middle School 6-8 | 1,114 Students | 3.8 miles away |  5 out of 5 | |
| Niguel Hills Middle School 6-8 | 1,389 Students | 4.6 miles away | 5 out of 5 | |
| San Joaquin Elementary School KG-6 | 609 Students | 4.9 miles away | 5 out of 5 | |
| Newport Coast Elementary School KG-6 | 731 Students | 5.1 miles away | Not Yet Rated | |
| Lomarena Elementary School KG-6 | 490 Students | 5.4 miles away | Not Yet Rated | |
| Valencia Elementary School KG-6 | 698 Students | 5.7 miles away | 5 out of 5 | |
| Olivewood Elementary School KG-6 | 435 Students | 6.2 miles away | Not Yet Rated | |
| Del Cerro Elementary School KG-6 | 623 Students | 6.3 miles away | Not Yet Rated | |
| Los Alisos Intermediate School 7-8 | 1,031 Students | 6.4 miles away | Not Yet Rated | |
Compare This School To Nearby Schools ->
School Community Forum

Join a discussion about Thurston Middle School and talk to others in the community including students, parents, teachers, and administrators.
Popular Discussion Topics
- Admissions and Registration Questions (e.g. Dress Code and Discipline Policy)
- School Calendar and Upcoming Events (e.g. Graduation)
- After School Programs, Extracurricular Activities, and Athletics (e.g. Football)
- News and Announcements (e.g. Yearbook and Class Supply List Details)
- Graduate and Alumni Events (e.g. Organizing Class Reunions)
Navigation
Can't Find What You Are Looking For?
Rankings
Nearby Cities
Sponsored Links
K-12 Articles

Middle School Homework and Study Habits
The report cards came home and you're disappointed with your child's scores. You know he has the...
The report cards came home and you're disappointed with your child's scores. You know he has the...

Halloween Safety Tips
Ghosts and witches sit beside mistletoe and tinsel on store shelves. Orange and black deck the...
Ghosts and witches sit beside mistletoe and tinsel on store shelves. Orange and black deck the...

Cell Phones... the Best Thing Since Sliced Bread or the Worst Invention in the World?
Cell phones are wonderful, the best things humans have ever invented! They help us keep in touch...
Cell phones are wonderful, the best things humans have ever invented! They help us keep in touch...