Benavides Secondary School
Rating
Not Available
Not Available

No Reviews Yet
Find Old Friends From Benavides Secondary School
Use the form below to search for alumni from Benavides Secondary School.
School Description
School Summary and Highlights
- Enrolls 190 middle and high school students from grades 7-12
- Ranks 1076th out of 1,325 high schools in TX.
- 2010 Overall School AYP Met Status: Yes
Additional Contact Information
- Mailing Address: P O Drawer P, Benavides, TX 78341
- Principal or Admin: Dr Ignacio Salinas Jr
- Fax: (361) 256-3043
- Website: www.benavidesisd.net
School Operational Details
- Title I EligibleAll students of this school are eligible for participation in authorized programs.
School District Details
- Benavides Independent School District (ISD)
- Per-Pupil Spending: $11,658
- Graduation Rate: 56.7%
- Dropout Rate: 8.0%
- Students Per Teacher: 11.7
- Enrolled Students: 408
Faculty Details and Student Enrollment
Students and Faculty
- Total Students Enrolled: 190
- Total Full Time "Equivalent" Teachers: 16.7
- Average Student-To-Teacher Ratio: 11.4
Students Gender Breakdown
- Males: 90 (47.4%)
- Females: 100 (52.6%)
Free Lunch Student Eligibility Breakdown
- Eligible for Reduced Lunch: 25 (13.2%)
- Eligible for Free Lunch: 94 (49.5%)
- Eligible for Either Reduced or Free Lunch: 119 (62.6%)
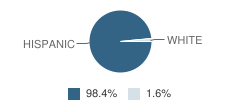
Student Enrollment Distribution by Race / Ethnicity
| Number | Percent | |
|---|---|---|
| American Indian | - | - |
| Black | - | - |
| Asian | - | - |
| Hispanic | 187 | 98.4% |
| White | 3 | 1.6% |
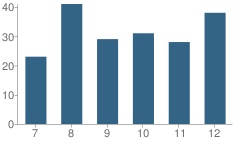
Number of Students Per Grade
| Number | Percent | |
|---|---|---|
| 7th Grade | 23 | 12.1% |
| 8th Grade | 41 | 21.6% |
| 9th Grade | 29 | 15.3% |
| 10th Grade | 31 | 16.3% |
| 11th Grade | 28 | 14.7% |
| 12th Grade | 38 | 20.0% |
Breakdown of College Ready Graduates (2009)
Percent Ready For College in Reading
School:
94.0%
District:
94.0%
State:
62.0%
Percent Ready For College in Math
School:
56.0%
State:
60.0%
Graduation & Dropout Rates (2009)
Graduation Rate
School:
65.5%
District:
65.5%
State:
80.6%
Dropout Rate
School:
17.2%
District:
17.2%
State:
9.4%
Faculty Breakdown (2010)
Average Teacher Experience
School:
17.5
District:
15.8
State:
11.3
Percent of Teachers With 1-5 Years Experience
School:
12.0%
District:
14.3%
State:
31.0%
Percent of Teachers With 6-10 Years Experience
School:
29.9%
District:
20.0%
State:
20.3%
Percent of Teachers With 11-20 Years Experience
School:
12.0%
District:
20.0%
State:
24.4%
Percent of Teachers With Greater Than 20 Years Experience
School:
40.2%
District:
37.2%
State:
18.3%
Faculty Salary (2010)
School Administration Average Base Salary
School:
$59,552
District:
$54,427
State:
$70,209
Teacher Average Base Salary
School:
$39,054
District:
$39,577
State:
$48,263
Beginning Teacher Average Base Salary
School:
$28,552
District:
$29,524
State:
$41,165
Teacher With 1-5 Years Experience Average Base Salary
School:
$31,552
State:
$43,527
Teacher With 6-10 Years Experience Average Base Salary
School:
$37,568
State:
$46,149
Teacher With 11-20 Years Experience Average Base Salary
School:
$44,318
State:
$50,153
Teacher With Greater Than 20 Years Experience Average Base Salary
School:
$42,391
State:
$58,427
Source: TX Department of Education, Source: NCES 2009-2010
School Ratings and Reviews
Be The First To Review Benavides Secondary School!
School Map and Similar Schools Nearby
Click to Activate Map of Nearby School Campuses
Private
Public
This School
Similar Schools Nearby
| Bernarda Jaime Junior High School 6-8 | 298 Students | 15.9 miles away | Not Yet Rated | |
| Ben Bolt-Pal Blanco High School 9-12 | 186 Students | 21.2 miles away | Not Yet Rated | |
| Freer High School 9-12 | 236 Students | 22.7 miles away | Not Yet Rated | |
| Freer Junior High School 6-8 | 176 Students | 22.9 miles away | Not Yet Rated | |
| Premont Junior High School 6-8 | 138 Students | 24.3 miles away | Not Yet Rated | |
| Hebbronville High School 9-12 | 293 Students | 24.4 miles away | Not Yet Rated | |
| Premont High School 9-12 | 219 Students | 24.5 miles away | Not Yet Rated | |
| Hebbronville Junior High School 6-8 | 226 Students | 24.7 miles away | Not Yet Rated | |
| Alice High School 9-12 | 1,396 Students | 25.8 miles away |  5 out of 5 | |
| Bruni High School 9-12 | 94 Students | 27.6 miles away | Not Yet Rated | |
Compare This School To Nearby Schools ->
School Community Forum

Join a discussion about Benavides Secondary School and talk to others in the community including students, parents, teachers, and administrators.
Popular Discussion Topics
- Admissions and Registration Questions (e.g. Dress Code and Discipline Policy)
- School Calendar and Upcoming Events (e.g. Graduation)
- After School Programs, Extracurricular Activities, and Athletics (e.g. Football)
- News and Announcements (e.g. Yearbook and Class Supply List Details)
- Graduate and Alumni Events (e.g. Organizing Class Reunions)
Navigation
Can't Find What You Are Looking For?
Nearby Cities
Sponsored Links
K-12 Articles

Teacher Tenure: A Double-Edged Sword
Teacher Tenure (the policy making it almost impossible to fire teachers) has noble roots. It was...
Teacher Tenure (the policy making it almost impossible to fire teachers) has noble roots. It was...

Exciting School Lunch Ideas
Earlier this week I had reason to drop by my grandsons' school at lunch time. While waiting for the...
Earlier this week I had reason to drop by my grandsons' school at lunch time. While waiting for the...

Teaching Your Child Study Skills
Many children who have the capability to get good grades experience frustration because of low...
Many children who have the capability to get good grades experience frustration because of low...