Animo Leadership High School
Rating
Not Available
Not Available

5 out of 5 | 1 Review
Find Old Friends From Animo Leadership High School
Use the form below to search for alumni from Animo Leadership High School.
School Description
School Summary and Highlights
- Enrolls 589 high school students from grades 9-12
- Ranks 731st out of 1,197 high schools in CA.
- 2010 Overall School AYP Met Status: Yes
Additional Contact Information
- Mailing Address: 1155 West Arbor Vitae St., Inglewood, CA 90301
School Operational Details
- Title I EligibleAll students of this school are eligible for participation in authorized programs.
- Charter School
School District Details
- Lennox Elementary School District
- Per-Pupil Spending: $10,007
- Graduation Rate: 44.8%
- Dropout Rate: 1.3%
- Students Per Teacher: 20.6
- Enrolled Students: 7,367
Faculty Details and Student Enrollment
Students and Faculty
- Total Students Enrolled: 589
- Total Full Time "Equivalent" Teachers: 31.0
- Average Student-To-Teacher Ratio: 19.0
Students Gender Breakdown
- Males: 282 (47.9%)
- Females: 307 (52.1%)
Free Lunch Student Eligibility Breakdown
- Eligible for Reduced Lunch: 78 (13.2%)
- Eligible for Free Lunch: 466 (79.1%)
- Eligible for Either Reduced or Free Lunch: 544 (92.4%)
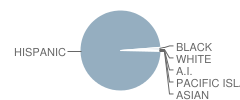
Student Enrollment Distribution by Race / Ethnicity
| Number | Percent | |
|---|---|---|
| American Indian | 1 | 0.2% |
| Black | 4 | 0.7% |
| Asian | 1 | 0.2% |
| Hispanic | 578 | 98.1% |
| White | 4 | 0.7% |
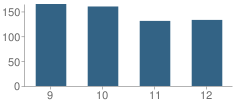
Number of Students Per Grade
| Number | Percent | |
|---|---|---|
| 9th Grade | 165 | 28.0% |
| 10th Grade | 160 | 27.2% |
| 11th Grade | 131 | 22.2% |
| 12th Grade | 133 | 22.6% |
Graduates Information (2010)
Graduation Rate
School:
92.4%
District:
100.0%
State:
78.6%
Teacher Education Background (2009)
Percent With Master's Degree
School:
35.3%
District:
57.9%
Percent With Bachelor's Degree: 35.3%
Teacher Credentials & Experience (2009)
Percent of Teachers With Emergency Credentials: 10.0%
Percent of Teachers With Credentials: 73.3%
Number of Certificated Staff: 34.0
Average Number of Years of Teacher Experience: 5.0
Average Age
School:
33.0
District:
42.0
Source: CA Department of Education, Source: NCES 2009-2010
School Ratings and Reviews
Overall Rating: 5

5 out of 5 | 1 Review
The Overall Rating is the school's average rating from parents, students, school faculty and staff. The highest rating is five apples and the lowest is one apple.
Share Your Review About This School
1 review for Animo Leadership High School
- Reviewed by Parent/Guardian on July 31, 2010
- Rating:
 (5 / 5) Flag as inappropriate
 - vacancy
School Map and Similar Schools Nearby
Click to Activate Map of Nearby School Campuses
Private
Public
This School
Similar Schools Nearby
| Lennox Mathematics, Science, and Technology Academy 9-12 | 535 Students | 1.8 miles away | Not Yet Rated | |
| Hawthorne Math and Science Academy High 9-12 | 612 Students | 2.6 miles away |  4.5 out of 5 | |
| Animo Inglewood Charter High School 9-12 | 545 Students | 2.6 miles away | Not Yet Rated | |
| Da Vinci Design School KG-12 | 196 Students | 3.1 miles away | Not Yet Rated | - |
| College Ready Academy High #7 9-12 | 302 Students | 3.3 miles away | Not Yet Rated | - |
| View Park Preparatory Accelerated High School 9-12 | 401 Students | 3.6 miles away |  5 out of 5 | |
| Animo South Los Angeles Charter School 9-12 | 537 Students | 4.1 miles away | Not Yet Rated | |
| College Ready Academy High #6 9-12 | 468 Students | 4.2 miles away |  1 out of 5 | |
| Health Services Academy High 9-12 | 142 Students | 4.4 miles away | Not Yet Rated | - |
| Academy for Recording Arts 9-12 | 66 Students | 4.4 miles away | Not Yet Rated | - |
Compare This School To Nearby Schools ->
School Community Forum

Join a discussion about Animo Leadership High School and talk to others in the community including students, parents, teachers, and administrators.
Popular Discussion Topics
- Admissions and Registration Questions (e.g. Dress Code and Discipline Policy)
- School Calendar and Upcoming Events (e.g. Graduation)
- After School Programs, Extracurricular Activities, and Athletics (e.g. Football)
- News and Announcements (e.g. Yearbook and Class Supply List Details)
- Graduate and Alumni Events (e.g. Organizing Class Reunions)
Navigation
Can't Find What You Are Looking For?
Rankings
Nearby Cities
Sponsored Links
K-12 Articles

Special Needs Education: Your Child, Your Rights
Many children today have special needs that make it difficult for them to learn. It's imperative...
Many children today have special needs that make it difficult for them to learn. It's imperative...

How to Get the Best Supplies for Your Money
School supply lists can seem unending, and the price can add up very quickly. But do we really...
School supply lists can seem unending, and the price can add up very quickly. But do we really...

Internet Safety for Kids of All Ages
Kids are being introduced to the Internet at a very young age. Research for homework and school...
Kids are being introduced to the Internet at a very young age. Research for homework and school...