Richland Junior High School
Rating
Not Available
Not Available

3 out of 5 | 1 Review
Find Old Friends From Richland Junior High School
Use the form below to search for alumni from Richland Junior High School.
School Description
School Summary and Highlights
- Enrolls 704 middle and high school students from grades 6-8
- Ranks 1874th out of 2,050 middle schools in CA.
- 2010 Overall School AYP Met Status: No
Additional Contact Information
- Mailing Address: 331 Shafter Ave., Shafter, CA 93263
School Operational Details
- Title I EligibleAll students of this school are eligible for participation in authorized programs.
School District Details
- Richland Union Elementary School District
- Per-Pupil Spending: $9,148
- Students Per Teacher: 21.4
- Enrolled Students: 3,248
Faculty Details and Student Enrollment
Students and Faculty
- Total Students Enrolled: 704
- Total Full Time "Equivalent" Teachers: 39.0
- Average Student-To-Teacher Ratio: 18.1
Students Gender Breakdown
- Males: 368 (52.3%)
- Females: 336 (47.7%)
Free Lunch Student Eligibility Breakdown
- Eligible for Reduced Lunch: 74 (10.5%)
- Eligible for Free Lunch: 543 (77.1%)
- Eligible for Either Reduced or Free Lunch: 617 (87.6%)
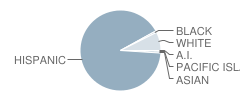
Student Enrollment Distribution by Race / Ethnicity
| Number | Percent | |
|---|---|---|
| American Indian | 1 | 0.1% |
| Black | 5 | 0.7% |
| Asian | 5 | 0.7% |
| Hispanic | 637 | 90.5% |
| White | 52 | 7.4% |
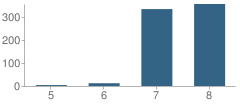
Number of Students Per Grade
| Number | Percent | |
|---|---|---|
| 5th Grade | 4 | 0.6% |
| 6th Grade | 12 | 1.7% |
| 7th Grade | 333 | 47.3% |
| 8th Grade | 355 | 50.4% |
Teacher Education Background (2009)
Percent With Master's Degree
School:
23.8%
District:
73.3%
Percent With Bachelor's Degree: 31.0%
Teacher Credentials & Experience (2009)
Percent of Teachers With Emergency Credentials: 5.1%
Percent of Teachers With Credentials: 89.7%
Number of Certificated Staff: 42.0
Average Number of Years of Teacher Experience: 13.0
Average Age
School:
42.5
District:
45.5
Source: CA Department of Education, Source: NCES 2009-2010
School Ratings and Reviews
Overall Rating: 3

3 out of 5 | 1 Review
The Overall Rating is the school's average rating from parents, students, school faculty and staff. The highest rating is five apples and the lowest is one apple.
Share Your Review About This School
1 review for Richland Junior High School
- Reviewed by Parent or Guardian on May 15, 2011
- Rating:
 (3 / 5) Flag as inappropriate
 - I really think this school is just average it could use better teachers and a better facility.
School Map and Similar Schools Nearby
Click to Activate Map of Nearby School Campuses
Private
Public
This School
Similar Schools Nearby
| Shafter High School 9-12 | 1,507 Students | 0.6 miles away | Not Yet Rated | |
| Wasco High School 9-12 | 1,659 Students | 7.4 miles away |  1 out of 5 | |
| Mcfarland High School 9-12 | 880 Students | 12.3 miles away | Not Yet Rated | |
| Centennial High School 9-12 | 1,858 Students | 12.4 miles away | Not Yet Rated | |
| Fruitvale Junior High School 7-8 | 702 Students | 12.8 miles away | Not Yet Rated | |
| Liberty High School 9-12 | 1,856 Students | 12.9 miles away | Not Yet Rated | |
| Stockdale High School 9-12 | 2,192 Students | 14.7 miles away | Not Yet Rated | |
| Beardsley Junior High School 7-8 | 361 Students | 14.9 miles away | Not Yet Rated | |
| North High School 9-12 | 2,195 Students | 15.1 miles away |  2.5 out of 5 | |
| Earl Warren Junior High School 7-8 | 817 Students | 15.9 miles away | Not Yet Rated | |
Compare This School To Nearby Schools ->
School Community Forum

Join a discussion about Richland Junior High School and talk to others in the community including students, parents, teachers, and administrators.
Popular Discussion Topics
- Admissions and Registration Questions (e.g. Dress Code and Discipline Policy)
- School Calendar and Upcoming Events (e.g. Graduation)
- After School Programs, Extracurricular Activities, and Athletics (e.g. Football)
- News and Announcements (e.g. Yearbook and Class Supply List Details)
- Graduate and Alumni Events (e.g. Organizing Class Reunions)
Navigation
Can't Find What You Are Looking For?
Rankings
Nearby Cities
Sponsored Links
K-12 Articles

Kids and Competition
In the backyard, the classroom, the community and while participating in sports and other...
In the backyard, the classroom, the community and while participating in sports and other...

It's the Most Wonderful Time of the Year!
For most of the country, school is starting up this week or later this month-at the beginning of...
For most of the country, school is starting up this week or later this month-at the beginning of...

When Bad Report Cards Happen to Good Kids
It’s mid-term season once again, and semester (or quarter or trimester) grades will be coming out...
It’s mid-term season once again, and semester (or quarter or trimester) grades will be coming out...