Falling Spring Elementary School
100 Falling Springs Circle, Hot Springs, VA 24445 | (540) 965-1815
- Grades: KG-5
- Student Enrollment: 173
Rating
Not Available
Not Available

No Reviews Yet
Find Old Friends From Falling Spring Elementary School
Use the form below to search for alumni from Falling Spring Elementary School.
School Description
School Summary and Highlights
- Enrolls 173 elementary school students from grades KG-5
- Ranks 157th out of 1,149 elementary schools in VA.
School District Details
- Alleghany County Public Schools District
- Per-Pupil Spending: $10,128
- Graduation Rate: 79.4%
- Dropout Rate: 2.1%
- Students Per Teacher: 15.2
- Enrolled Students: 2,848
Faculty Details and Student Enrollment
Students and Faculty
- Total Students Enrolled: 173
- Total Full Time "Equivalent" Teachers: 12.6
- Average Student-To-Teacher Ratio: 13.7
Students Gender Breakdown
- Males: 85 (49.1%)
- Females: 86 (49.7%)
Free Lunch Student Eligibility Breakdown
- Eligible for Reduced Lunch: 7 (4.0%)
- Eligible for Free Lunch: 23 (13.3%)
- Eligible for Either Reduced or Free Lunch: 30 (17.3%)
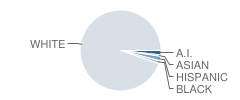
Student Enrollment Distribution by Race / Ethnicity
| Number | Percent | |
|---|---|---|
| American Indian | 3 | 1.7% |
| Black | 2 | 1.2% |
| Asian | 1 | 0.6% |
| Hispanic | 3 | 1.7% |
| White | 162 | 93.6% |
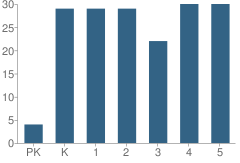
Number of Students Per Grade
| Number | Percent | |
|---|---|---|
| Pre-Kindergarten | 4 | 2.3% |
| Kindergarten | 29 | 16.8% |
| 1st Grade | 29 | 16.8% |
| 2nd Grade | 29 | 16.8% |
| 3rd Grade | 22 | 12.7% |
| 4th Grade | 30 | 17.3% |
| 5th Grade | 30 | 17.3% |
Source: VA Department of Education, Source: NCES 2009-2010
School Ratings and Reviews
Be The First To Review Falling Spring Elementary School!
School Map and Similar Schools Nearby
Click to Activate Map of Nearby School Campuses
Private
Public
This School
Similar Schools Nearby
| Callaghan Elementary School PK-5 | 212 Students | 7.6 miles away | Not Yet Rated | |
| Mt. View Elementary School PK-5 | 572 Students | 8.1 miles away | Not Yet Rated | |
| Valley Elementary School PK-7 | 245 Students | 9.0 miles away | Not Yet Rated | |
| Jeter-Watson Intermediate School 4-7 | 249 Students | 9.4 miles away | Not Yet Rated | |
| Edgemont Primary School PK-3 | 337 Students | 9.4 miles away | Not Yet Rated | |
| Sharon Elementary School PK-5 | 204 Students | 13.7 miles away | Not Yet Rated | |
| Boiling Spring Elementary School PK-5 | 134 Students | 15.1 miles away | Not Yet Rated | |
| Eagle Rock Elementary School PK-5 | 154 Students | 18.3 miles away |  5 out of 5 | |
| Millboro Elementary School PK-7 | 134 Students | 21.1 miles away | Not Yet Rated | |
| Effinger Elementary School PK-5 | 100 Students | 25.5 miles away | Not Yet Rated | |
Compare This School To Nearby Schools ->
School Community Forum

Join a discussion about Falling Spring Elementary School and talk to others in the community including students, parents, teachers, and administrators.
Popular Discussion Topics
- Admissions and Registration Questions (e.g. Dress Code and Discipline Policy)
- School Calendar and Upcoming Events (e.g. Graduation)
- After School Programs, Extracurricular Activities, and Athletics (e.g. Football)
- News and Announcements (e.g. Yearbook and Class Supply List Details)
- Graduate and Alumni Events (e.g. Organizing Class Reunions)
Navigation
Can't Find What You Are Looking For?
Rankings
Nearby Cities
Sponsored Links
K-12 Articles

Halloween Safety Tips
Ghosts and witches sit beside mistletoe and tinsel on store shelves. Orange and black deck the...
Ghosts and witches sit beside mistletoe and tinsel on store shelves. Orange and black deck the...

Keeping Our Kids Safe in the Post 9/11 World
Recently, radio talk show host and CNN personality did a week-long special entitled “The Perfect...
Recently, radio talk show host and CNN personality did a week-long special entitled “The Perfect...

Idle Hands
The worst affliction affecting our kids today is not teen pregnancy, drugs and alcohol, or...
The worst affliction affecting our kids today is not teen pregnancy, drugs and alcohol, or...