Hillsville Elementary School
Rating
Not Available
Not Available

No Reviews Yet
Find Old Friends From Hillsville Elementary School
Use the form below to search for alumni from Hillsville Elementary School.
School Description
School Summary and Highlights
- Enrolls 499 preschool and elementary school students from grades PK-5
- Ranks 843rd out of 1,149 elementary schools in VA.
Additional Contact Information
- Mailing Address: 90 Patriot Lane, Hillsville, VA 24343
School Operational Details
- Title I Eligible
School District Details
- Carroll County Public Schools District
- Per-Pupil Spending: $9,328
- Graduation Rate: 67.2%
- Dropout Rate: 2.3%
- Students Per Teacher: 15.9
- Enrolled Students: 4,113
Faculty Details and Student Enrollment
Students and Faculty
- Total Students Enrolled: 499
- Total Full Time "Equivalent" Teachers: 36.4
- Average Student-To-Teacher Ratio: 13.7
Students Gender Breakdown
- Males: 254 (50.9%)
- Females: 243 (48.7%)
Free Lunch Student Eligibility Breakdown
- Eligible for Reduced Lunch: 42 (8.4%)
- Eligible for Free Lunch: 241 (48.3%)
- Eligible for Either Reduced or Free Lunch: 283 (56.7%)
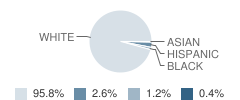
Student Enrollment Distribution by Race / Ethnicity
| Number | Percent | |
|---|---|---|
| American Indian | - | - |
| Black | 6 | 1.2% |
| Asian | 2 | 0.4% |
| Hispanic | 13 | 2.6% |
| White | 476 | 95.4% |
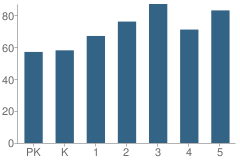
Number of Students Per Grade
| Number | Percent | |
|---|---|---|
| Pre-Kindergarten | 57 | 11.4% |
| Kindergarten | 58 | 11.6% |
| 1st Grade | 67 | 13.4% |
| 2nd Grade | 76 | 15.2% |
| 3rd Grade | 87 | 17.4% |
| 4th Grade | 71 | 14.2% |
| 5th Grade | 83 | 16.6% |
Source: VA Department of Education, Source: NCES 2009-2010
School Ratings and Reviews
Be The First To Review Hillsville Elementary School!
School Map and Similar Schools Nearby
Click to Activate Map of Nearby School Campuses
Private
Public
This School
Similar Schools Nearby
| Laurel Elementary School PK-5 | 285 Students | 8.3 miles away |  5 out of 5 | |
| Jackson Memorial Elementary School PK-5 | 246 Students | 9.3 miles away | Not Yet Rated | |
| Fancy Gap Elementary School PK-5 | 173 Students | 10.0 miles away | Not Yet Rated | |
| Gladesboro Elementary School PK-5 | 141 Students | 11.5 miles away | Not Yet Rated | |
| Gladeville Elementary School KG-5 | 344 Students | 13.3 miles away | 5 out of 5 | |
| Snowville Elementary School PK-5 | 208 Students | 13.5 miles away | Not Yet Rated | |
| Willis Elementary School PK-7 | 232 Students | 13.6 miles away | Not Yet Rated | |
| Indian Valley Elementary School PK-7 | 185 Students | 15.1 miles away | Not Yet Rated | |
| Critzer Elementary School PK-5 | 493 Students | 15.6 miles away | 5 out of 5 | |
| St. Paul School PK-7 | 414 Students | 15.9 miles away | Not Yet Rated | |
Compare This School To Nearby Schools ->
School Community Forum

Join a discussion about Hillsville Elementary School and talk to others in the community including students, parents, teachers, and administrators.
Popular Discussion Topics
- Admissions and Registration Questions (e.g. Dress Code and Discipline Policy)
- School Calendar and Upcoming Events (e.g. Graduation)
- After School Programs, Extracurricular Activities, and Athletics (e.g. Football)
- News and Announcements (e.g. Yearbook and Class Supply List Details)
- Graduate and Alumni Events (e.g. Organizing Class Reunions)
Navigation
Can't Find What You Are Looking For?
Rankings
Nearby Cities
Sponsored Links
K-12 Articles

Asperger Syndrome: A Developmental Disorder on the Autism Spectrum
Asperger Syndrome, also known as Pervasive Developmental Disorder is on the high functioning end of...
Asperger Syndrome, also known as Pervasive Developmental Disorder is on the high functioning end of...

Teaching Kids to Deal with Peer Pressure
Parents usually become very concerned when they hear the term "peer pressure." However, peer...
Parents usually become very concerned when they hear the term "peer pressure." However, peer...

Parent-Teacher Conference Dos and Don'ts
Finals are over and done, and grades have arrived. Now comes the dreaded time to discuss the...
Finals are over and done, and grades have arrived. Now comes the dreaded time to discuss the...