Evergreen Elementary School
1701 Evergreen East Parkway, Midlothian, VA 23114 | (804) 378-2400
- Grades: PK-5
- Student Enrollment: 932
Rating
Not Available
Not Available

5 out of 5 | 1 Review
Find Old Friends From Evergreen Elementary School
Use the form below to search for alumni from Evergreen Elementary School.
School Description
School Summary and Highlights
- Enrolls 932 preschool and elementary school students from grades PK-5
- Ranks 94th out of 1,149 elementary schools in VA.
Additional Contact Information
- Mailing Address: 1701 Evergreen East Pkwy., Midlothian, VA 23114
School District Details
- Chesterfield County Public Schools District
- Per-Pupil Spending: $9,025
- Graduation Rate: 86.8%
- Dropout Rate: 3.4%
- Students Per Teacher: 19.3
- Enrolled Students: 59,509
Faculty Details and Student Enrollment
Students and Faculty
- Total Students Enrolled: 932
- Total Full Time "Equivalent" Teachers: 47.8
- Average Student-To-Teacher Ratio: 19.5
Students Gender Breakdown
- Males: 445 (47.7%)
- Females: 479 (51.4%)
Free Lunch Student Eligibility Breakdown
- Eligible for Reduced Lunch: 51 (5.5%)
- Eligible for Free Lunch: 110 (11.8%)
- Eligible for Either Reduced or Free Lunch: 161 (17.3%)
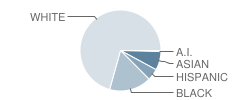
Student Enrollment Distribution by Race / Ethnicity
| Number | Percent | |
|---|---|---|
| American Indian | 4 | 0.4% |
| Black | 155 | 16.6% |
| Asian | 69 | 7.4% |
| Hispanic | 43 | 4.6% |
| White | 653 | 70.1% |
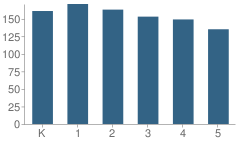
Number of Students Per Grade
| Number | Percent | |
|---|---|---|
| Kindergarten | 161 | 17.3% |
| 1st Grade | 171 | 18.3% |
| 2nd Grade | 163 | 17.5% |
| 3rd Grade | 153 | 16.4% |
| 4th Grade | 149 | 16.0% |
| 5th Grade | 135 | 14.5% |
Source: VA Department of Education, Source: NCES 2009-2010
School Ratings and Reviews
Overall Rating: 5

5 out of 5 | 1 Review
The Overall Rating is the school's average rating from parents, students, school faculty and staff. The highest rating is five apples and the lowest is one apple.
Share Your Review About This School
1 review for Evergreen Elementary School
- Reviewed by Parent/Guardian on July 23, 2009
- Rating:
 (5 / 5) Flag as inappropriate
 - good good school
School Map and Similar Schools Nearby
Click to Activate Map of Nearby School Campuses
Private
Public
This School
Similar Schools Nearby
| W. W. Gordon Elementary School PK-5 | 652 Students | 1.3 miles away | Not Yet Rated | |
| Providence Elementary School PK-5 | 658 Students | 1.5 miles away | Not Yet Rated | |
| Swift Creek Elementary School PK-5 | 825 Students | 1.9 miles away |  5 out of 5 | |
| Reams Road Elementary School PK-5 | 540 Students | 2.8 miles away | 5 out of 5 | |
| Thelma Crenshaw Elementary School PK-5 | 763 Students | 3.4 miles away | 5 out of 5 | |
| Clover Hill Elementary School PK-5 | 847 Students | 4.0 miles away | 5 out of 5 | |
| Greenfield Elementary School PK-5 | 595 Students | 4.2 miles away | 5 out of 5 | |
| Woolridge Elementary School PK-5 | 802 Students | 4.4 miles away | 5 out of 5 | |
| Robious Elementary School PK-5 | 670 Students | 4.5 miles away | Not Yet Rated | |
| Alberta Smith Elementary School PK-5 | 737 Students | 4.8 miles away | 5 out of 5 | |
Compare This School To Nearby Schools ->
School Community Forum

Join a discussion about Evergreen Elementary School and talk to others in the community including students, parents, teachers, and administrators.
Popular Discussion Topics
- Admissions and Registration Questions (e.g. Dress Code and Discipline Policy)
- School Calendar and Upcoming Events (e.g. Graduation)
- After School Programs, Extracurricular Activities, and Athletics (e.g. Football)
- News and Announcements (e.g. Yearbook and Class Supply List Details)
- Graduate and Alumni Events (e.g. Organizing Class Reunions)
Navigation
Can't Find What You Are Looking For?
Rankings
Nearby Cities
Sponsored Links
K-12 Articles

Middle School Homework and Study Habits
The report cards came home and you're disappointed with your child's scores. You know he has the...
The report cards came home and you're disappointed with your child's scores. You know he has the...

Idle Hands
The worst affliction affecting our kids today is not teen pregnancy, drugs and alcohol, or...
The worst affliction affecting our kids today is not teen pregnancy, drugs and alcohol, or...

Special Needs Education: Your Child, Your Rights
Many children today have special needs that make it difficult for them to learn. It's imperative...
Many children today have special needs that make it difficult for them to learn. It's imperative...