Lodi High School

5 out of 5 | 2 Reviews
Find Old Friends From Lodi High School
Use the form below to search for alumni from Lodi High School.
School Description
School Summary and Highlights
- Enrolls 2,059 high school students from grades 9-12
- Ranks 342nd out of 1,197 high schools in CA.
- 2010 Overall School AYP Met Status: No
Additional Contact Information
- Mailing Address: 3 Pacific Ave., Lodi, CA 95242
School District Details
- Lodi Unified School District
- Per-Pupil Spending: $8,662
- Graduation Rate: 66.6%
- Dropout Rate: 3.0%
- Students Per Teacher: 22.0
- Enrolled Students: 30,860
Faculty Details and Student Enrollment
Students and Faculty
- Total Students Enrolled: 2,059
- Total Full Time "Equivalent" Teachers: 87.3
- Average Student-To-Teacher Ratio: 23.6
Students Gender Breakdown
- Males: 1,014 (49.2%)
- Females: 1,045 (50.8%)
Free Lunch Student Eligibility Breakdown
- Eligible for Reduced Lunch: 148 (7.2%)
- Eligible for Free Lunch: 671 (32.6%)
- Eligible for Either Reduced or Free Lunch: 819 (39.8%)
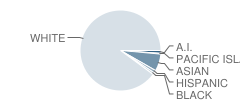
Student Enrollment Distribution by Race / Ethnicity

| Number | Percent | |
|---|---|---|
| American Indian | 17 | 0.8% |
| Black | 12 | 0.6% |
| Asian | 95 | 4.6% |
| Hispanic | 16 | 0.8% |
| White | 1,224 | 59.4% |
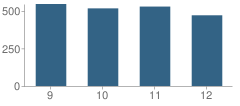
Number of Students Per Grade

| Number | Percent | |
|---|---|---|
| 9th Grade | 545 | 26.5% |
| 10th Grade | 516 | 25.1% |
| 11th Grade | 528 | 25.6% |
| 12th Grade | 470 | 22.8% |
Graduates Information (2010)
Graduation Rate
School:
93.2%
District:
79.3%
State:
78.6%
Teacher Education Background (2009)
Percent With Ph.D.
School:
88.5%
District:
6.8%
Percent With Master's Degree
School:
32.7%
District:
55.7%
Percent With Bachelor's Degree
School:
6.2%
District:
3.4%
Teacher Credentials & Experience (2009)
Percent of Teachers With Emergency Credentials: 5.0%
Percent of Teachers With Credentials: 96.0%
Number of Certificated Staff: 113.0
Average Number of Years of Teacher Experience: 15.1
Average Age
School:
42.8
District:
47.9
Source: CA Department of Education, Source: NCES 2009-2010
Sponsored Links
Test Scores and Performance Information
Overall School Rating
How is this determined?
The overall school rating shows that Lodi High School performed on average better than many other schools across the state on CST state exams in the following subjects:
- CST Algebra I
- CST Algebra II
- CST Biology
- CST Chemistry
- CST Earth Science
- CST English-Language Arts
- CST General Mathematics
- CST Geometry
- CST Physics
- CST Science
- CST Summative High School Math
- CST U.S. History
- CST World History
AYP Results (2010)
Overall AYP Met: No
ELA AYP Met: Yes
Math AYP Met: No
ACT Exam Results (2009)
Percent of Students Taking ACT Exam: 18.1%
Average Combined Score: 22.4
Percent Scoring At or Above 21: 64.5%
SAT Exam Results (2009)
Percent of Students Taking SAT Exam: 29.4%
Average Combined Score: 1,532.3
Critical Reading Average: 501.5
Math Average: 531.3
Writing Average: 499.5
Percent Scoring At or Above 1500: 50.3%
CST - Test Proficiency by Grade and Subject
Grade 9 - % of students at or above proficiency
| School | District | State | |
|---|---|---|---|
| CST Algebra I Test | |||
| 2010 | 31.0% | 22.0% | 22.0% |
| 2009 | 32.0% | 22.0% | 21.0% |
| 2008 | 37.0% | 22.0% | 18.0% |
| CST Algebra II Test | |||
| 2010 | 85.0% | 69.0% | 69.0% |
| 2009 | 88.0% | 75.0% | 65.0% |
| CST Biology Test | |||
| 2010 | 88.0% | 75.0% | 55.0% |
| 2009 | 76.0% | 67.0% | 51.0% |
| 2008 | 88.0% | 75.0% | 52.0% |
| CST Earth Science Test | |||
| 2010 | 49.0% | 36.0% | 35.0% |
| 2009 | 36.0% | 28.0% | 29.0% |
| 2008 | 44.0% | 29.0% | 31.0% |
| CST English-Language Arts Test | |||
| 2010 | 60.0% | 52.0% | 54.0% |
| 2009 | 54.0% | 46.0% | 50.0% |
| 2008 | 56.0% | 46.0% | 49.0% |
| CST Geometry Test | |||
| 2010 | 66.0% | 40.0% | 46.0% |
| 2009 | 51.0% | 49.0% | 47.0% |
| 2008 | 77.0% | 48.0% | 43.0% |
| CST General Mathematics Test | |||
| 2009 | 4.0% | 6.0% | 17.0% |
Grade 10 - % of students at or above proficiency
| School | District | State | |
|---|---|---|---|
| CST Algebra I Test | |||
| 2010 | 9.0% | 8.0% | 12.0% |
| 2009 | 21.0% | 10.0% | 11.0% |
| 2008 | 15.0% | 10.0% | 9.0% |
| CST Algebra II Test | |||
| 2010 | 47.0% | 43.0% | 40.0% |
| 2009 | 52.0% | 41.0% | 37.0% |
| 2008 | 42.0% | 39.0% | 36.0% |
| CST Biology Test | |||
| 2010 | 45.0% | 33.0% | 38.0% |
| 2009 | 42.0% | 29.0% | 34.0% |
| 2008 | 42.0% | 34.0% | 35.0% |
| CST Chemistry Test | |||
| 2010 | 81.0% | 55.0% | 47.0% |
| 2009 | 87.0% | 52.0% | 44.0% |
| 2008 | 59.0% | 45.0% | 41.0% |
| CST Earth Science Test | |||
| 2010 | 39.0% | 26.0% | 29.0% |
| 2009 | 28.0% | 19.0% | 23.0% |
| 2008 | 56.0% | 22.0% | 23.0% |
| CST English-Language Arts Test | |||
| 2010 | 47.0% | 41.0% | 45.0% |
| 2009 | 46.0% | 39.0% | 44.0% |
| 2008 | 46.0% | 37.0% | 41.0% |
| CST Geometry Test | |||
| 2010 | 11.0% | 10.0% | 14.0% |
| 2009 | 19.0% | 15.0% | 14.0% |
| 2008 | 30.0% | 17.0% | 12.0% |
| CST Physics Test | |||
| 2010 | 47.0% | 49.0% | 44.0% |
| 2009 | 53.0% | 54.0% | 40.0% |
| 2008 | 54.0% | 59.0% | 36.0% |
| CST Science Test | |||
| 2010 | 55.0% | 41.0% | 46.0% |
| 2009 | 52.0% | 39.0% | 44.0% |
| 2008 | 52.0% | 38.0% | 40.0% |
| CST Summative High School Math Test | |||
| 2010 | 87.0% | 77.0% | 75.0% |
| CST World History Test | |||
| 2010 | 45.0% | 34.0% | 42.0% |
| 2009 | 42.0% | 32.0% | 38.0% |
| 2008 | 36.0% | 31.0% | 33.0% |
Grade 11 - % of students at or above proficiency
| School | District | State | |
|---|---|---|---|
| CST Algebra I Test | |||
| 2010 | 5.0% | 3.0% | 8.0% |
| 2009 | 14.0% | 5.0% | 8.0% |
| 2008 | 10.0% | 5.0% | 5.0% |
| CST Algebra II Test | |||
| 2010 | 20.0% | 20.0% | 14.0% |
| 2009 | 20.0% | 16.0% | 12.0% |
| 2008 | 37.0% | 21.0% | 11.0% |
| CST Biology Test | |||
| 2010 | 38.0% | 37.0% | 46.0% |
| 2009 | 36.0% | 27.0% | 41.0% |
| 2008 | 39.0% | 32.0% | 39.0% |
| CST Chemistry Test | |||
| 2010 | 66.0% | 29.0% | 30.0% |
| 2009 | 60.0% | 28.0% | 27.0% |
| 2008 | 54.0% | 27.0% | 25.0% |
| CST Earth Science Test | |||
| 2010 | 28.0% | 18.0% | 32.0% |
| 2009 | 30.0% | 24.0% | 26.0% |
| 2008 | 8.0% | 19.0% | 28.0% |
| CST English-Language Arts Test | |||
| 2010 | 39.0% | 35.0% | 42.0% |
| 2009 | 45.0% | 35.0% | 40.0% |
| 2008 | 37.0% | 31.0% | 37.0% |
| CST Geometry Test | |||
| 2010 | 7.0% | 7.0% | 6.0% |
| 2009 | 11.0% | 8.0% | 7.0% |
| 2008 | 14.0% | 11.0% | 6.0% |
| CST Physics Test | |||
| 2010 | 39.0% | 47.0% | 53.0% |
| 2009 | 46.0% | 44.0% | 50.0% |
| 2008 | 51.0% | 56.0% | 47.0% |
| CST Summative High School Math Test | |||
| 2010 | 69.0% | 55.0% | 50.0% |
| 2009 | 62.0% | 48.0% | 47.0% |
| 2008 | 61.0% | 45.0% | 43.0% |
| CST U.S. History Test | |||
| 2010 | 46.0% | 38.0% | 45.0% |
| 2009 | 45.0% | 40.0% | 44.0% |
| 2008 | 39.0% | 33.0% | 38.0% |
| CST World History Test | |||
| 2009 | 11.0% | 15.0% | 11.0% |
End of Course - % of students at or above proficiency
| School | District | State | |
|---|---|---|---|
| CST Algebra I Test | |||
| 2010 | 25.0% | 21.0% | 31.0% |
| 2009 | 27.0% | 22.0% | 28.0% |
| 2008 | 27.0% | 20.0% | 25.0% |
| CST Algebra II Test | |||
| 2010 | 34.0% | 35.0% | 31.0% |
| 2009 | 39.0% | 32.0% | 28.0% |
| 2008 | 39.0% | 32.0% | 27.0% |
| CST Biology Test | |||
| 2010 | 50.0% | 41.0% | 46.0% |
| 2009 | 48.0% | 36.0% | 42.0% |
| 2008 | 49.0% | 40.0% | 42.0% |
| CST Chemistry Test | |||
| 2010 | 73.0% | 39.0% | 38.0% |
| 2009 | 72.0% | 36.0% | 36.0% |
| 2008 | 56.0% | 33.0% | 32.0% |
| CST Earth Science Test | |||
| 2010 | 47.0% | 34.0% | 33.0% |
| 2009 | 36.0% | 27.0% | 28.0% |
| 2008 | 43.0% | 28.0% | 28.0% |
| CST Geometry Test | |||
| 2010 | 19.0% | 21.0% | 27.0% |
| 2009 | 24.0% | 23.0% | 26.0% |
| 2008 | 37.0% | 27.0% | 24.0% |
| CST Physics Test | |||
| 2010 | 41.0% | 44.0% | 49.0% |
| 2009 | 48.0% | 47.0% | 46.0% |
| 2008 | 51.0% | 57.0% | 43.0% |
| CST Summative High School Math Test | |||
| 2010 | 72.0% | 59.0% | 54.0% |
| 2009 | 62.0% | 48.0% | 50.0% |
| 2008 | 61.0% | 46.0% | 47.0% |
| CST World History Test | |||
| 2010 | 45.0% | 32.0% | 41.0% |
| 2009 | 41.0% | 30.0% | 38.0% |
| 2008 | 35.0% | 28.0% | 33.0% |
| CST General Mathematics Test | |||
| 2009 | 4.0% | 6.0% | 26.0% |
Source: CA Department of Education 2009-2010
School Map and Similar Schools Nearby
Click to Activate Map of Nearby School Campuses
Private
Public
This School
Similar Schools Nearby
| Tokay High School 9-12 | 2,113 Students | 1.7 miles away | ![]() 5 out of 5 | |
| Ronald E. Mcnair High School 9-12 | 1,981 Students | 6.5 miles away | ![]() 5 out of 5 | |
| Bear Creek High School 9-12 | 1,995 Students | 6.7 miles away | ![]() 3.5 out of 5 | |
| Galt High School 9-12 | 1,492 Students | 8.5 miles away | ![]() 5 out of 5 | |
| Cesar Chavez High School 9-12 | 2,321 Students | 8.5 miles away | ![]() 4.5 out of 5 | |
| Lincoln High School 9-12 | 2,587 Students | 8.9 miles away | ![]() 5 out of 5 | |
| Middle College High School 9-12 | 242 Students | 9.7 miles away | ![]() 5 out of 5 | |
| Stagg High School 9-12 | 1,860 Students | 10.4 miles away | ![]() 3.5 out of 5 | |
| Liberty Ranch High School 9-10 | 602 Students | 10.5 miles away | Not Yet Rated | - |
| Franklin High School 6-12 | 2,553 Students | 11.9 miles away | ![]() 3 out of 5 | |
Compare This School To Nearby Schools ->
School Community Forum

Join a discussion about Lodi High School and talk to others in the community including students, parents, teachers, and administrators.
Popular Discussion Topics
- Admissions and Registration Questions (e.g. Dress Code and Discipline Policy)
- School Calendar and Upcoming Events (e.g. Graduation)
- After School Programs, Extracurricular Activities, and Athletics (e.g. Football)
- News and Announcements (e.g. Yearbook and Class Supply List Details)
- Graduate and Alumni Events (e.g. Organizing Class Reunions)
Navigation
Can't Find What You Are Looking For?
Rankings
Nearby Cities
Sponsored Links
K-12 Articles
What to Do when Your Child Hates School
All kids grumble about going to school at one time or another. This is perfectly normal, but what...
Asperger Syndrome: A Developmental Disorder on the Autism Spectrum
Asperger Syndrome, also known as Pervasive Developmental Disorder is on the high functioning end of...
Beating the Summer Slump
"The Summer Slump", teachers call it. It happens every year. It makes its way into lesson plans...


(5 / 5) 


