Independence School
Rating
Not Available
Not Available

No Reviews Yet
Find Old Friends From Independence School
Use the form below to search for alumni from Independence School.
School Description
School Summary and Highlights
- Enrolls 419 elementary, middle, and high school students from grades KG-12
- 2010 Overall School AYP Met Status: No
Additional Contact Information
- Mailing Address: 660 West Walnut St., Lodi, CA 95240
School Operational Details
- Alternative School
School District Details
- Lodi Unified School District
- Per-Pupil Spending: $8,662
- Graduation Rate: 66.6%
- Dropout Rate: 3.0%
- Students Per Teacher: 22.0
- Enrolled Students: 30,860
Faculty Details and Student Enrollment
Students and Faculty
- Total Students Enrolled: 419
- Total Full Time "Equivalent" Teachers: 15.6
- Average Student-To-Teacher Ratio: 26.8
Students Gender Breakdown
- Males: 177 (42.2%)
- Females: 242 (57.8%)
Free Lunch Student Eligibility Breakdown
- Eligible for Reduced Lunch: 26 (6.2%)
- Eligible for Free Lunch: 137 (32.7%)
- Eligible for Either Reduced or Free Lunch: 163 (38.9%)
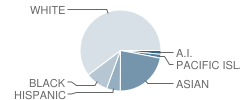
Student Enrollment Distribution by Race / Ethnicity
| Number | Percent | |
|---|---|---|
| American Indian | 6 | 1.4% |
| Black | 27 | 6.4% |
| Asian | 63 | 15.0% |
| Hispanic | 17 | 4.1% |
| White | 169 | 40.3% |
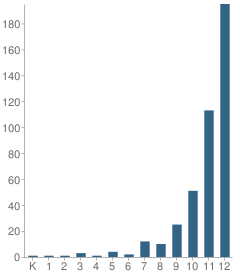
Number of Students Per Grade
| Number | Percent | |
|---|---|---|
| Kindergarten | 1 | 0.2% |
| 1st Grade | 1 | 0.2% |
| 2nd Grade | 1 | 0.2% |
| 3rd Grade | 3 | 0.7% |
| 4th Grade | 1 | 0.2% |
| 5th Grade | 4 | 1.0% |
| 6th Grade | 2 | 0.5% |
| 7th Grade | 12 | 2.9% |
| 8th Grade | 10 | 2.4% |
| 9th Grade | 25 | 6.0% |
| 10th Grade | 51 | 12.2% |
| 11th Grade | 113 | 27.0% |
| 12th Grade | 195 | 46.5% |
Graduates Information (2010)
Graduation Rate
School:
79.3%
District:
79.3%
State:
78.6%
Teacher Education Background (2009)
Percent With Master's Degree
School:
42.9%
District:
55.7%
Percent With Bachelor's Degree
School:
4.8%
District:
3.4%
Teacher Credentials & Experience (2009)
Percent of Teachers With Emergency Credentials: 5.0%
Percent of Teachers With Credentials: 90.0%
Number of Certificated Staff: 21.0
Average Number of Years of Teacher Experience: 18.5
Average Age
School:
54.0
District:
47.9
Source: CA Department of Education, Source: NCES 2009-2010
School Ratings and Reviews
Be The First To Review Independence School!
School Map and Similar Schools Nearby
Click to Activate Map of Nearby School Campuses
Private
Public
This School
Similar Schools Nearby
| Liberty High School 9-12 | 131 Students | 0 miles away | Not Yet Rated | |
| Henderson Community Day School 7-9 | 125 Students | 2.7 miles away |  4.5 out of 5 | |
| Plaza Robles Continuation High School 9-12 | 169 Students | 7.3 miles away |  5 out of 5 | |
| Larsson (Sture) High (Continuation) School 9-12 | 222 Students | 9.0 miles away | Not Yet Rated | |
| Estrellita Continuation High School 9-12 | 192 Students | 10.7 miles away | Not Yet Rated | |
| Model Alternative School 9-12 | 280 Students | 12.1 miles away | Not Yet Rated | |
| Weber Institute School 9-12 | 423 Students | 12.4 miles away | Not Yet Rated | |
| Linden Unified Community Day School 7-12 | 4 Students | 12.9 miles away | Not Yet Rated | - |
| Pride Continuation School 9-12 | 63 Students | 13.2 miles away | Not Yet Rated | - |
| Edward C. Merlo Institute of Environmental Studies School 9-12 | 238 Students | 13.6 miles away | Not Yet Rated | - |
Compare This School To Nearby Schools ->
School Community Forum

Join a discussion about Independence School and talk to others in the community including students, parents, teachers, and administrators.
Popular Discussion Topics
- Admissions and Registration Questions (e.g. Dress Code and Discipline Policy)
- School Calendar and Upcoming Events (e.g. Graduation)
- After School Programs, Extracurricular Activities, and Athletics (e.g. Football)
- News and Announcements (e.g. Yearbook and Class Supply List Details)
- Graduate and Alumni Events (e.g. Organizing Class Reunions)
Navigation
Can't Find What You Are Looking For?
Rankings
Nearby Cities
Sponsored Links
K-12 Articles

Is Your Child's Teacher a Bully?
We've all heard about kids being bullied by peers. Kids taunt, tease, pull hair, shove and push...
We've all heard about kids being bullied by peers. Kids taunt, tease, pull hair, shove and push...

Internet Safety for Kids of All Ages
Kids are being introduced to the Internet at a very young age. Research for homework and school...
Kids are being introduced to the Internet at a very young age. Research for homework and school...

Cutting Class
Depression is a very real problem for today's youth. When your spirit doesn't feel good, a lot of...
Depression is a very real problem for today's youth. When your spirit doesn't feel good, a lot of...