Springfield Estates Elementary School
Rating
Not Available
Not Available

No Reviews Yet
Find Old Friends From Springfield Estates Elementary School
Use the form below to search for alumni from Springfield Estates Elementary School.
School Description
School Summary and Highlights
- Enrolls 665 preschool and elementary school students from grades PK-6
- Ranks 150th out of 1,149 elementary schools in VA.
School District Details
- Fairfax County Public Schools District
- Per-Pupil Spending: $13,275
- Graduation Rate: 86.0%
- Dropout Rate: 2.2%
- Students Per Teacher: 19.7
- Enrolled Students: 171,901
Faculty Details and Student Enrollment
Students and Faculty
- Total Students Enrolled: 665
- Total Full Time "Equivalent" Teachers: 28.1
- Average Student-To-Teacher Ratio: 23.7
Students Gender Breakdown
- Males: 310 (46.6%)
- Females: 304 (45.7%)
Free Lunch Student Eligibility Breakdown
- Eligible for Reduced Lunch: 46 (6.9%)
- Eligible for Free Lunch: 161 (24.2%)
- Eligible for Either Reduced or Free Lunch: 207 (31.1%)
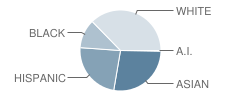
Student Enrollment Distribution by Race / Ethnicity
| Number | Percent | |
|---|---|---|
| American Indian | 2 | 0.3% |
| Black | 71 | 10.7% |
| Asian | 168 | 25.3% |
| Hispanic | 144 | 21.7% |
| White | 229 | 34.4% |
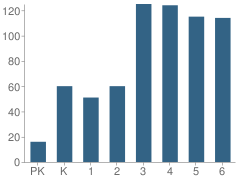
Number of Students Per Grade
| Number | Percent | |
|---|---|---|
| Pre-Kindergarten | 16 | 2.4% |
| Kindergarten | 60 | 9.0% |
| 1st Grade | 51 | 7.7% |
| 2nd Grade | 60 | 9.0% |
| 3rd Grade | 125 | 18.8% |
| 4th Grade | 124 | 18.6% |
| 5th Grade | 115 | 17.3% |
| 6th Grade | 114 | 17.1% |
Source: VA Department of Education, Source: NCES 2009-2010
School Ratings and Reviews
Be The First To Review Springfield Estates Elementary School!
School Map and Similar Schools Nearby
Click to Activate Map of Nearby School Campuses
Private
Public
This School
Similar Schools Nearby
| Franconia Elementary School PK-6 | 500 Students | 1.1 miles away | Not Yet Rated | |
| Lynbrook Elementary School PK-6 | 479 Students | 1.3 miles away | Not Yet Rated | |
| Garfield Elementary School PK-6 | 324 Students | 1.5 miles away |  5 out of 5 | |
| Crestwood Elementary School PK-6 | 576 Students | 1.7 miles away |  3.5 out of 5 | |
| Lane Elementary School PK-6 | 721 Students | 1.7 miles away | Not Yet Rated | |
| Bush Hill Elementary School PK-6 | 455 Students | 2.3 miles away |  4 out of 5 | |
| Rose Hill Elementary School PK-6 | 759 Students | 2.5 miles away | Not Yet Rated | |
| Samuel W. Tucker Elementary School KG-5 | 711 Students | 2.6 miles away | 5 out of 5 | |
| Hayfield Elementary School PK-6 | 642 Students | 2.8 miles away | Not Yet Rated | |
| Island Creek Elementary School PK-6 | 782 Students | 2.9 miles away |  1 out of 5 | |
Compare This School To Nearby Schools ->
School Community Forum

Join a discussion about Springfield Estates Elementary School and talk to others in the community including students, parents, teachers, and administrators.
Popular Discussion Topics
- Admissions and Registration Questions (e.g. Dress Code and Discipline Policy)
- School Calendar and Upcoming Events (e.g. Graduation)
- After School Programs, Extracurricular Activities, and Athletics (e.g. Football)
- News and Announcements (e.g. Yearbook and Class Supply List Details)
- Graduate and Alumni Events (e.g. Organizing Class Reunions)
Navigation
Can't Find What You Are Looking For?
Rankings
Nearby Cities
Sponsored Links
K-12 Articles

The Cervical Cancer Vaccine
All across North America girls between the ages of 11 and 12 have the opportunity to be vaccinated...
All across North America girls between the ages of 11 and 12 have the opportunity to be vaccinated...

Helping Young Children with Printing and Cursive Writing
Is your child experiencing difficulty printing or writing? Is he unable to print or write legibly,...
Is your child experiencing difficulty printing or writing? Is he unable to print or write legibly,...

Idle Hands
The worst affliction affecting our kids today is not teen pregnancy, drugs and alcohol, or...
The worst affliction affecting our kids today is not teen pregnancy, drugs and alcohol, or...