Stenwood Elementary School
Rating
Not Available
Not Available

No Reviews Yet
Find Old Friends From Stenwood Elementary School
Use the form below to search for alumni from Stenwood Elementary School.
School Description
School Summary and Highlights
- Enrolls 466 preschool and elementary school students from grades PK-6
- Ranks 166th out of 1,149 elementary schools in VA.
School Operational Details
- Magnet School
School District Details
- Fairfax County Public Schools District
- Per-Pupil Spending: $13,275
- Graduation Rate: 86.0%
- Dropout Rate: 2.2%
- Students Per Teacher: 19.7
- Enrolled Students: 171,901
Faculty Details and Student Enrollment
Students and Faculty
- Total Students Enrolled: 466
- Total Full Time "Equivalent" Teachers: 26.8
- Average Student-To-Teacher Ratio: 17.4
Students Gender Breakdown
- Males: 213 (45.7%)
- Females: 223 (47.9%)
Free Lunch Student Eligibility Breakdown
- Eligible for Reduced Lunch: 3 (0.6%)
- Eligible for Free Lunch: 37 (7.9%)
- Eligible for Either Reduced or Free Lunch: 40 (8.6%)
Student Enrollment Distribution by Race / Ethnicity
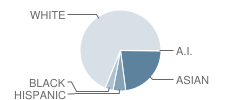
| Number | Percent | |
|---|---|---|
| American Indian | 1 | 0.2% |
| Black | 14 | 3.0% |
| Asian | 99 | 21.2% |
| Hispanic | 22 | 4.7% |
| White | 300 | 64.4% |
Number of Students Per Grade
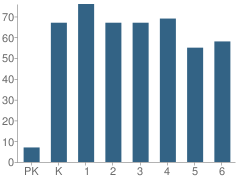
| Number | Percent | |
|---|---|---|
| Pre-Kindergarten | 7 | 1.5% |
| Kindergarten | 67 | 14.4% |
| 1st Grade | 76 | 16.3% |
| 2nd Grade | 67 | 14.4% |
| 3rd Grade | 67 | 14.4% |
| 4th Grade | 69 | 14.8% |
| 5th Grade | 55 | 11.8% |
| 6th Grade | 58 | 12.4% |
Source: VA Department of Education, Source: NCES 2009-2010
School Ratings and Reviews
Be The First To Review Stenwood Elementary School!
School Map and Similar Schools Nearby
Click to Activate Map of Nearby School Campuses
Private
Public
This School
Similar Schools Nearby
| Shrevewood Elementary School PK-6 | 527 Students | 1.3 miles away | Not Yet Rated | |
| Cunningham Park Elementary School PK-6 | 433 Students | 1.3 miles away | Not Yet Rated | |
| Pine Spring Elementary School PK-6 | 564 Students | 1.4 miles away |  5 out of 5 | |
| Fairhill Elementary School PK-6 | 616 Students | 1.6 miles away |  4 out of 5 | |
| Timber Lane Elementary School PK-6 | 498 Students | 1.7 miles away | Not Yet Rated | |
| Freedom Hill Elementary School PK-6 | 566 Students | 1.9 miles away | 5 out of 5 | |
| Marshall Road Elementary School PK-6 | 582 Students | 2.0 miles away | Not Yet Rated | |
| Mary Ellen Henderson Middle School 5-7 | 452 Students | 2.1 miles away | Not Yet Rated | |
| Vienna Elementary School PK-6 | 408 Students | 2.1 miles away | Not Yet Rated | |
| Graham Road Elementary School PK-6 | 406 Students | 2.1 miles away | Not Yet Rated | |
Compare This School To Nearby Schools ->
School Community Forum

Join a discussion about Stenwood Elementary School and talk to others in the community including students, parents, teachers, and administrators.
Popular Discussion Topics
- Admissions and Registration Questions (e.g. Dress Code and Discipline Policy)
- School Calendar and Upcoming Events (e.g. Graduation)
- After School Programs, Extracurricular Activities, and Athletics (e.g. Football)
- News and Announcements (e.g. Yearbook and Class Supply List Details)
- Graduate and Alumni Events (e.g. Organizing Class Reunions)
Navigation
Can't Find What You Are Looking For?
Rankings
Nearby Cities
Sponsored Links
K-12 Articles

Helping Your Child Leave the Nest
It's all come down to this: Eighteen years of good times and bad, and now your baby bird is ready...
It's all come down to this: Eighteen years of good times and bad, and now your baby bird is ready...

The Adolescent Monster
"What happened to my sweet little baby?" Every parent has or will ask that sometime during the...
"What happened to my sweet little baby?" Every parent has or will ask that sometime during the...

Where in the World is Carmen Sandiego?
One of the sensations on YouTube highlights the state of our education system. The spot was...
One of the sensations on YouTube highlights the state of our education system. The spot was...