Middle College High School
Rating
Not Available
Not Available

5 out of 5 | 3 Reviews
Find Old Friends From Middle College High School
Use the form below to search for alumni from Middle College High School.
School Description
School Summary and Highlights
- Enrolls 242 high school students from grades 9-12
- Ranks 132nd out of 1,197 high schools in CA.
- 2010 Overall School AYP Met Status: Yes
- National Blue Ribbon Schools Award 2008

Additional Contact Information
- Mailing Address: 5151 Pacific Ave., Stockton, CA 95207
School District Details
- Lodi Unified School District
- Per-Pupil Spending: $8,662
- Graduation Rate: 66.6%
- Dropout Rate: 3.0%
- Students Per Teacher: 22.0
- Enrolled Students: 30,860
Faculty Details and Student Enrollment
Students and Faculty
- Total Students Enrolled: 242
- Total Full Time "Equivalent" Teachers: 7.8
- Average Student-To-Teacher Ratio: 31.0
Students Gender Breakdown
- Males: 85 (35.1%)
- Females: 157 (64.9%)
Free Lunch Student Eligibility Breakdown
- Eligible for Reduced Lunch: 34 (14.0%)
- Eligible for Free Lunch: 73 (30.2%)
- Eligible for Either Reduced or Free Lunch: 107 (44.2%)
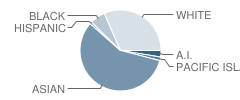
Student Enrollment Distribution by Race / Ethnicity
| Number | Percent | |
|---|---|---|
| American Indian | 5 | 2.1% |
| Black | 11 | 4.5% |
| Asian | 98 | 40.5% |
| Hispanic | 2 | 0.8% |
| White | 54 | 22.3% |
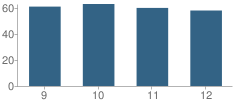
Number of Students Per Grade
| Number | Percent | |
|---|---|---|
| 9th Grade | 61 | 25.2% |
| 10th Grade | 63 | 26.0% |
| 11th Grade | 60 | 24.8% |
| 12th Grade | 58 | 24.0% |
Graduates Information (2010)
Graduation Rate
School:
98.5%
District:
79.3%
State:
78.6%
Teacher Education Background (2009)
Percent With Master's Degree
School:
33.3%
District:
55.7%
Percent With Bachelor's Degree
School:
11.1%
District:
3.4%
Teacher Credentials & Experience (2009)
Percent of Teachers With Credentials: 100.0%
Number of Certificated Staff: 9.0
Average Number of Years of Teacher Experience: 14.9
Average Age
School:
44.1
District:
47.9
Source: CA Department of Education, Source: NCES 2009-2010
School Ratings and Reviews
Overall Rating: 5

5 out of 5 | 3 Reviews
The Overall Rating is the school's average rating from parents, students, school faculty and staff. The highest rating is five apples and the lowest is one apple.
Share Your Review About This School
3 reviews for Middle College High School
- Reviewed by Former Student on June 15, 2010
- Rating:
 (5 / 5) Flag as inappropriate
 - My name is Margaret (Margie) Gonzales Garcia I attended school on 11/1969, the name was High School Equivalency Program or H.E.P. at the University Of Pacific College Campus. I received my G.E.D. 7/1970. Is the school still there? Did they change the name?I'm trying to locate my classmates after 40 years. Who can I talk to? If you can help me it will me a lot to me thank you.
Margaret Gonzales Garcia
Class of 1970
My phone is (559) 834-6206
pcs1002622@yahoo
- Reviewed by Student on November 15, 2008
- Rating: (5 / 5) Flag as inappropriate
- This school has challenged me more than anything I have ever done! Its true do not assume your kid deserves this privilege. You have to be mature and basicly be ready to deal with the adult world at 14. By far this school is the best In california!
- Reviewed by Student on September 19, 2007
- Rating: (5 / 5) Flag as inappropriate
- MCHS rules. It's a nerd school, though, and if you're a student, you'd better know what you're doing. Also, if you're an over-bearing parent, we won't take your kid cause parents are annoying.
Don't think your kid deserves the right to go to college early. It's a privilege, and I'm proud to be a student here, even if it may cost me my soul.
Closest thing to a sport we have is Academic Decathlon. Ah wells.
Cheerio. =D
School Map and Similar Schools Nearby
Click to Activate Map of Nearby School Campuses
Private
Public
This School
Similar Schools Nearby
| Stagg High School 9-12 | 1,860 Students | 0.8 miles away |  3.5 out of 5 | |
| Lincoln High School 9-12 | 2,587 Students | 1.5 miles away |  5 out of 5 | |
| Cesar Chavez High School 9-12 | 2,321 Students | 3.1 miles away |  4.5 out of 5 | |
| Ronald E. Mcnair High School 9-12 | 1,981 Students | 3.2 miles away | Not Yet Rated | |
| Bear Creek High School 9-12 | 1,995 Students | 4.3 miles away | 3.5 out of 5 | |
| Edison High School 9-12 | 2,119 Students | 4.4 miles away | Not Yet Rated | |
| Franklin High School 6-12 | 2,553 Students | 4.8 miles away |  3 out of 5 | |
| Weston Ranch High School 9-12 | 1,283 Students | 6.6 miles away | Not Yet Rated | |
| Tokay High School 9-12 | 2,113 Students | 8.2 miles away | 5 out of 5 | |
| Lodi High School 9-12 | 2,059 Students | 9.7 miles away | 5 out of 5 | |
Compare This School To Nearby Schools ->
School Community Forum

Join a discussion about Middle College High School and talk to others in the community including students, parents, teachers, and administrators.
Popular Discussion Topics
- Admissions and Registration Questions (e.g. Dress Code and Discipline Policy)
- School Calendar and Upcoming Events (e.g. Graduation)
- After School Programs, Extracurricular Activities, and Athletics (e.g. Football)
- News and Announcements (e.g. Yearbook and Class Supply List Details)
- Graduate and Alumni Events (e.g. Organizing Class Reunions)
Navigation
Can't Find What You Are Looking For?
Rankings
Nearby Cities
Sponsored Links
K-12 Articles

Assisting Students to Overcome Test Anxiety
Every human copes with anxiety at one time or another. It is a basic emotion that we feel when...
Every human copes with anxiety at one time or another. It is a basic emotion that we feel when...

The Difference Between Boys and Girls
Boys and girls are different. Give a toddler girl a G.I. Joe and she'll probably try to mother it....
Boys and girls are different. Give a toddler girl a G.I. Joe and she'll probably try to mother it....

The Impact on Adopted Children at School
Children who are adopted can be affected both academically and socially at school. Many times...
Children who are adopted can be affected both academically and socially at school. Many times...