Providence Elementary School
Rating
Not Available
Not Available

No Reviews Yet
Find Old Friends From Providence Elementary School
Use the form below to search for alumni from Providence Elementary School.
School Description
School Summary and Highlights
- Enrolls 878 preschool and elementary school students from grades PK-6
- Ranks 574th out of 1,149 elementary schools in VA.
School Operational Details
- Title I Eligible
- Magnet School
School District Details
- Fairfax County Public Schools District
- Per-Pupil Spending: $13,275
- Graduation Rate: 86.0%
- Dropout Rate: 2.2%
- Students Per Teacher: 19.7
- Enrolled Students: 171,901
Faculty Details and Student Enrollment
Students and Faculty
- Total Students Enrolled: 878
- Total Full Time "Equivalent" Teachers: 57.7
- Average Student-To-Teacher Ratio: 15.2
Students Gender Breakdown
- Males: 416 (47.4%)
- Females: 409 (46.6%)
Free Lunch Student Eligibility Breakdown
- Eligible for Reduced Lunch: 84 (9.6%)
- Eligible for Free Lunch: 218 (24.8%)
- Eligible for Either Reduced or Free Lunch: 302 (34.4%)
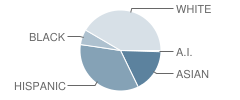
Student Enrollment Distribution by Race / Ethnicity
| Number | Percent | |
|---|---|---|
| American Indian | 4 | 0.5% |
| Black | 50 | 5.7% |
| Asian | 143 | 16.3% |
| Hispanic | 285 | 32.5% |
| White | 343 | 39.1% |
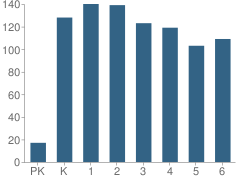
Number of Students Per Grade
| Number | Percent | |
|---|---|---|
| Pre-Kindergarten | 17 | 1.9% |
| Kindergarten | 128 | 14.6% |
| 1st Grade | 140 | 15.9% |
| 2nd Grade | 139 | 15.8% |
| 3rd Grade | 123 | 14.0% |
| 4th Grade | 119 | 13.6% |
| 5th Grade | 103 | 11.7% |
| 6th Grade | 109 | 12.4% |
Source: VA Department of Education, Source: NCES 2009-2010
School Ratings and Reviews
Be The First To Review Providence Elementary School!
School Map and Similar Schools Nearby
Click to Activate Map of Nearby School Campuses
Private
Public
This School
Similar Schools Nearby
| Waples Mill Elementary School PK-6 | 833 Students | 1.3 miles away |  5 out of 5 | |
| Oakton Elementary School PK-6 | 667 Students | 1.6 miles away |  4 out of 5 | |
| Fairfax Villa Elementary School PK-6 | 389 Students | 1.6 miles away | Not Yet Rated | |
| Daniels Run Elementary School PK-6 | 774 Students | 1.9 miles away | Not Yet Rated | |
| Eagle View Elementary School PK-6 | 885 Students | 2.1 miles away | Not Yet Rated | |
| Mosby Woods Elementary School PK-6 | 732 Students | 2.2 miles away | 5 out of 5 | |
| Flint Hill Elementary School PK-6 | 667 Students | 3.2 miles away | Not Yet Rated | |
| Oak View Elementary School PK-6 | 688 Students | 3.3 miles away | Not Yet Rated | |
| Navy Elementary School PK-6 | 834 Students | 3.3 miles away | Not Yet Rated | |
| Marshall Road Elementary School PK-6 | 582 Students | 3.5 miles away | Not Yet Rated | |
Compare This School To Nearby Schools ->
School Community Forum

Join a discussion about Providence Elementary School and talk to others in the community including students, parents, teachers, and administrators.
Popular Discussion Topics
- Admissions and Registration Questions (e.g. Dress Code and Discipline Policy)
- School Calendar and Upcoming Events (e.g. Graduation)
- After School Programs, Extracurricular Activities, and Athletics (e.g. Football)
- News and Announcements (e.g. Yearbook and Class Supply List Details)
- Graduate and Alumni Events (e.g. Organizing Class Reunions)
Navigation
Can't Find What You Are Looking For?
Rankings
Nearby Cities
Sponsored Links
K-12 Articles

Teaching Your Child Study Skills
Many children who have the capability to get good grades experience frustration because of low...
Many children who have the capability to get good grades experience frustration because of low...

Simple Math ... a Simple Gift
Math affects every aspect of our lives-from balancing the checkbook to estimating the amount of...
Math affects every aspect of our lives-from balancing the checkbook to estimating the amount of...

Cut the Credit and Save You Some Money
Today's society glorifies a get-it-now mentality. Children learn this early. You probably noticed...
Today's society glorifies a get-it-now mentality. Children learn this early. You probably noticed...