Willis Elementary School
Rating
Not Available
Not Available

No Reviews Yet
Find Old Friends From Willis Elementary School
Use the form below to search for alumni from Willis Elementary School.
School Description
School Summary and Highlights
- Enrolls 232 preschool and elementary school students from grades PK-7
- Ranks 10th out of 419 middle schools in VA.
Additional Contact Information
- Mailing Address: P. O. Box 10, Willis, VA 24380
School Operational Details
- Title I Eligible
School District Details
- Floyd County Public Schools District
- Per-Pupil Spending: $8,952
- Graduation Rate: 78.7%
- Dropout Rate: 3.5%
- Students Per Teacher: 15.8
- Enrolled Students: 2,078
Faculty Details and Student Enrollment
Students and Faculty
- Total Students Enrolled: 232
- Total Full Time "Equivalent" Teachers: 17.0
- Average Student-To-Teacher Ratio: 13.6
Students Gender Breakdown
- Males: 123 (53.0%)
- Females: 109 (47.0%)
Free Lunch Student Eligibility Breakdown
- Eligible for Reduced Lunch: 30 (12.9%)
- Eligible for Free Lunch: 79 (34.1%)
- Eligible for Either Reduced or Free Lunch: 109 (47.0%)
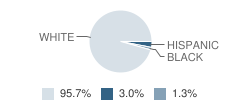
Student Enrollment Distribution by Race / Ethnicity
| Number | Percent | |
|---|---|---|
| American Indian | - | - |
| Black | 3 | 1.3% |
| Asian | - | - |
| Hispanic | 7 | 3.0% |
| White | 222 | 95.7% |
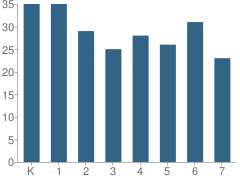
Number of Students Per Grade
| Number | Percent | |
|---|---|---|
| Kindergarten | 35 | 15.1% |
| 1st Grade | 35 | 15.1% |
| 2nd Grade | 29 | 12.5% |
| 3rd Grade | 25 | 10.8% |
| 4th Grade | 28 | 12.1% |
| 5th Grade | 26 | 11.2% |
| 6th Grade | 31 | 13.4% |
| 7th Grade | 23 | 9.9% |
Source: VA Department of Education, Source: NCES 2009-2010
School Ratings and Reviews
Be The First To Review Willis Elementary School!
School Map and Similar Schools Nearby
Click to Activate Map of Nearby School Campuses
Private
Public
This School
Similar Schools Nearby
| Floyd Elementary School PK-7 | 501 Students | 9.0 miles away | Not Yet Rated | |
| Indian Valley Elementary School PK-7 | 185 Students | 9.7 miles away | Not Yet Rated | |
| Woolwine Elementary School PK-7 | 241 Students | 10.0 miles away | Not Yet Rated | |
| Meadows of Dan Elementary School PK-7 | 125 Students | 12.6 miles away | Not Yet Rated | |
| Auburn Elementary School PK-5 | 617 Students | 13.5 miles away | Not Yet Rated | |
| Hillsville Elementary School PK-5 | 499 Students | 13.6 miles away | Not Yet Rated | |
| Snowville Elementary School PK-5 | 208 Students | 13.8 miles away | Not Yet Rated | |
| Gladesboro Elementary School PK-5 | 141 Students | 14.7 miles away | Not Yet Rated | |
| Check Elementary School PK-7 | 354 Students | 16.6 miles away | Not Yet Rated | |
| Fancy Gap Elementary School PK-5 | 173 Students | 17.7 miles away | Not Yet Rated | |
Compare This School To Nearby Schools ->
School Community Forum

Join a discussion about Willis Elementary School and talk to others in the community including students, parents, teachers, and administrators.
Popular Discussion Topics
- Admissions and Registration Questions (e.g. Dress Code and Discipline Policy)
- School Calendar and Upcoming Events (e.g. Graduation)
- After School Programs, Extracurricular Activities, and Athletics (e.g. Football)
- News and Announcements (e.g. Yearbook and Class Supply List Details)
- Graduate and Alumni Events (e.g. Organizing Class Reunions)
Navigation
Can't Find What You Are Looking For?
Rankings
Nearby Cities
Sponsored Links
K-12 Articles

Changing Schools Isn't Easy: Tips for a Successful Transition
It isn't easy for students to make the transition into a new school, especially if they have...
It isn't easy for students to make the transition into a new school, especially if they have...

Hurt: A Book Report
My last book report was over 15 years ago, and I'm a bit rusty, but here goes (Don't forget: book...
My last book report was over 15 years ago, and I'm a bit rusty, but here goes (Don't forget: book...

Cut the Credit and Save You Some Money
Today's society glorifies a get-it-now mentality. Children learn this early. You probably noticed...
Today's society glorifies a get-it-now mentality. Children learn this early. You probably noticed...