Arthur Hapgood Elementary School
Rating
Not Available
Not Available

No Reviews Yet
Find Old Friends From Arthur Hapgood Elementary School
Use the form below to search for alumni from Arthur Hapgood Elementary School.
School Description
School Summary and Highlights
- Enrolls 430 elementary school students from grades KG-6
- Ranks 5180th out of 5,423 elementary schools in CA.
- 2010 Overall School AYP Met Status: No
Additional Contact Information
- Mailing Address: PO Box 8000, Lompoc, CA 93438
School Operational Details
- Title I EligibleAll students of this school are eligible for participation in authorized programs.
School District Details
- Lompoc Unified School District
- Per-Pupil Spending: $8,720
- Graduation Rate: 64.3%
- Dropout Rate: 3.1%
- Students Per Teacher: 22.5
- Enrolled Students: 10,124
Faculty Details and Student Enrollment
Students and Faculty
- Total Students Enrolled: 430
- Total Full Time "Equivalent" Teachers: 20.3
- Average Student-To-Teacher Ratio: 21.2
Students Gender Breakdown
- Males: 226 (52.6%)
- Females: 204 (47.4%)
Free Lunch Student Eligibility Breakdown
- Eligible for Reduced Lunch: 62 (14.4%)
- Eligible for Free Lunch: 298 (69.3%)
- Eligible for Either Reduced or Free Lunch: 360 (83.7%)
Student Enrollment Distribution by Race / Ethnicity
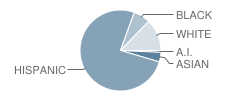
| Number | Percent | |
|---|---|---|
| American Indian | 3 | 0.7% |
| Black | 28 | 6.5% |
| Asian | 16 | 3.7% |
| Hispanic | 316 | 73.5% |
| White | 53 | 12.3% |
Number of Students Per Grade
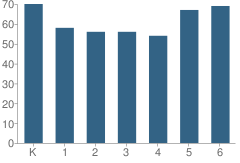
| Number | Percent | |
|---|---|---|
| Kindergarten | 70 | 16.3% |
| 1st Grade | 58 | 13.5% |
| 2nd Grade | 56 | 13.0% |
| 3rd Grade | 56 | 13.0% |
| 4th Grade | 54 | 12.6% |
| 5th Grade | 67 | 15.6% |
| 6th Grade | 69 | 16.0% |
Teacher Education Background (2009)
Percent With Master's Degree
School:
14.3%
District:
20.0%
Percent With Bachelor's Degree
School:
17.9%
District:
17.5%
Teacher Credentials & Experience (2009)
Percent of Teachers With Emergency Credentials: 14.8%
Percent of Teachers With Credentials: 81.5%
Number of Certificated Staff: 28.0
Average Number of Years of Teacher Experience: 13.0
Average Age
School:
45.1
District:
47.3
Source: CA Department of Education, Source: NCES 2009-2010
School Ratings and Reviews
Be The First To Review Arthur Hapgood Elementary School!
School Map and Similar Schools Nearby
Click to Activate Map of Nearby School Campuses
Private
Public
This School
Similar Schools Nearby
| Leonora Fillmore Elementary School KG-6 | 663 Students | 1.1 miles away | Not Yet Rated | |
| La Honda Elementary School KG-6 | 482 Students | 1.5 miles away | Not Yet Rated | |
| La Canada Elementary School KG-6 | 700 Students | 1.5 miles away |  5 out of 5 | |
| Miguelito Elementary School KG-6 | 546 Students | 1.6 miles away | Not Yet Rated | |
| Clarence Ruth Elementary School KG-6 | 625 Students | 1.8 miles away | Not Yet Rated | |
| Los Berros Elementary School KG-6 | 453 Students | 4.3 miles away | Not Yet Rated | |
| Buena Vista Elementary School KG-6 | 547 Students | 5.2 miles away | Not Yet Rated | |
| Crestview Elementary School KG-6 | 653 Students | 9.6 miles away | Not Yet Rated | |
| Olga L. Reed Elementary School KG-8 | 226 Students | 12.0 miles away | Not Yet Rated | |
| Oak Valley Elementary School KG-5 | 478 Students | 13.7 miles away | 5 out of 5 | |
Compare This School To Nearby Schools ->
School Community Forum

Join a discussion about Arthur Hapgood Elementary School and talk to others in the community including students, parents, teachers, and administrators.
Popular Discussion Topics
- Admissions and Registration Questions (e.g. Dress Code and Discipline Policy)
- School Calendar and Upcoming Events (e.g. Graduation)
- After School Programs, Extracurricular Activities, and Athletics (e.g. Football)
- News and Announcements (e.g. Yearbook and Class Supply List Details)
- Graduate and Alumni Events (e.g. Organizing Class Reunions)
Navigation
Can't Find What You Are Looking For?
Rankings
Nearby Cities
Sponsored Links
K-12 Articles

Attend Your Teen's Holiday Parties
Christmas and New Years are coming, and with them Christmas and New Years Eve parties. At many of...
Christmas and New Years are coming, and with them Christmas and New Years Eve parties. At many of...

Summer Reading
In 1998, a book was published in the US that turned a hatred of reading to love. "Harry Potter and...
In 1998, a book was published in the US that turned a hatred of reading to love. "Harry Potter and...

Summer Safety Tips to Keep Kids Safe
It won't be long until kids run from the school, shrieking in delight because they're free for the...
It won't be long until kids run from the school, shrieking in delight because they're free for the...