Lompoc High School

5 out of 5 | 1 Review
Find Old Friends From Lompoc High School
Use the form below to search for alumni from Lompoc High School.
School Description
School Summary and Highlights
- Enrolls 1,436 high school students from grades 9-12
- Ranks 924th out of 1,197 high schools in CA.
- 2010 Overall School AYP Met Status: No
Additional Contact Information
- Mailing Address: PO Box 8000, Lompoc, CA 93438
School Operational Details
- Title I EligibleAll students of this school are eligible for participation in authorized programs.
School District Details
- Lompoc Unified School District
- Per-Pupil Spending: $8,720
- Graduation Rate: 64.3%
- Dropout Rate: 3.1%
- Students Per Teacher: 22.5
- Enrolled Students: 10,124
Faculty Details and Student Enrollment
Students and Faculty
- Total Students Enrolled: 1,436
- Total Full Time "Equivalent" Teachers: 60.1
- Average Student-To-Teacher Ratio: 23.9
Students Gender Breakdown
- Males: 708 (49.3%)
- Females: 728 (50.7%)
Free Lunch Student Eligibility Breakdown
- Eligible for Reduced Lunch: 193 (13.4%)
- Eligible for Free Lunch: 725 (50.5%)
- Eligible for Either Reduced or Free Lunch: 918 (63.9%)
Student Enrollment Distribution by Race / Ethnicity
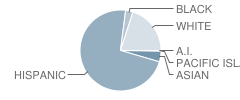
| Number | Percent | |
|---|---|---|
| American Indian | 2 | 0.1% |
| Black | 41 | 2.9% |
| Asian | 58 | 4.0% |
| Hispanic | 982 | 68.4% |
| White | 271 | 18.9% |
Number of Students Per Grade

| Number | Percent | |
|---|---|---|
| 9th Grade | 394 | 27.4% |
| 10th Grade | 378 | 26.3% |
| 11th Grade | 326 | 22.7% |
| 12th Grade | 338 | 23.5% |
Graduates Information (2010)
Graduation Rate
School:
87.4%
District:
86.6%
State:
78.6%
Teacher Education Background (2009)
Percent With Master's Degree
School:
26.9%
District:
20.0%
Percent With Bachelor's Degree
School:
10.3%
District:
17.5%
Teacher Credentials & Experience (2009)
Percent of Teachers With Emergency Credentials: 7.5%
Percent of Teachers With Credentials: 88.1%
Number of Certificated Staff: 78.0
Average Number of Years of Teacher Experience: 13.1
Average Age
School:
43.2
District:
47.3
Source: CA Department of Education, Source: NCES 2009-2010
Sponsored Links
Test Scores and Performance Information
Overall School Rating
How is this determined?
The overall school rating shows that Lompoc High School performed on average worse than many other schools across the state on CST state exams in the following subjects:
- CST Algebra I
- CST Algebra II
- CST Biology
- CST Chemistry
- CST Earth Science
- CST English-Language Arts
- CST General Mathematics
- CST Geometry
- CST Physics
- CST Science
- CST Summative High School Math
- CST U.S. History
- CST World History
AYP Results (2010)
Overall AYP Met: No
ELA AYP Met: No
Math AYP Met: No
Program Improvement (PI) Requirement Under NCLB (2010)
First Year PI Requirement was Implemented: 2008-2009
School's Placement Under NCLB: Year 3
ACT Exam Results (2009)
Percent of Students Taking ACT Exam: 11.2%
Average Combined Score: 20.3
Percent Scoring At or Above 21: 41.2%
SAT Exam Results (2009)
Percent of Students Taking SAT Exam: 18.1%
Average Combined Score: 1,472.0
Critical Reading Average: 500.6
Math Average: 491.1
Writing Average: 480.4
Percent Scoring At or Above 1500: 43.6%
CST - Test Proficiency by Grade and Subject
Grade 9 - % of students at or above proficiency
| School | District | State | |
|---|---|---|---|
| CST Algebra I Test | |||
| 2010 | 15.0% | 11.0% | 22.0% |
| 2009 | 9.0% | 10.0% | 21.0% |
| 2008 | 7.0% | 13.0% | 18.0% |
| CST Biology Test | |||
| 2010 | 50.0% | 75.0% | 55.0% |
| 2009 | 50.0% | 64.0% | 51.0% |
| 2008 | 33.0% | 53.0% | 52.0% |
| CST Earth Science Test | |||
| 2010 | 27.0% | 34.0% | 35.0% |
| 2009 | 22.0% | 32.0% | 29.0% |
| 2008 | 24.0% | 38.0% | 31.0% |
| CST English-Language Arts Test | |||
| 2010 | 47.0% | 53.0% | 54.0% |
| 2009 | 40.0% | 49.0% | 50.0% |
| 2008 | 43.0% | 52.0% | 49.0% |
| CST General Mathematics Test | |||
| 2010 | 6.0% | 12.0% | 17.0% |
| 2009 | 9.0% | 9.0% | 17.0% |
| 2008 | 24.0% | 18.0% | 18.0% |
| CST Geometry Test | |||
| 2010 | 31.0% | 55.0% | 46.0% |
| 2009 | 43.0% | 48.0% | 47.0% |
| 2008 | 39.0% | 53.0% | 43.0% |
| CST World History Test | |||
| 2010 | 4.0% | 8.0% | 45.0% |
| 2009 | 8.0% | 15.0% | 41.0% |
Grade 10 - % of students at or above proficiency
| School | District | State | |
|---|---|---|---|
| CST Algebra I Test | |||
| 2010 | 5.0% | 5.0% | 12.0% |
| 2009 | 5.0% | 3.0% | 11.0% |
| 2008 | 2.0% | 1.0% | 9.0% |
| CST Algebra II Test | |||
| 2010 | 27.0% | 37.0% | 40.0% |
| 2009 | 21.0% | 40.0% | 37.0% |
| 2008 | 28.0% | 34.0% | 36.0% |
| CST Biology Test | |||
| 2010 | 21.0% | 39.0% | 38.0% |
| 2009 | 12.0% | 35.0% | 34.0% |
| 2008 | 17.0% | 35.0% | 35.0% |
| CST Chemistry Test | |||
| 2010 | 36.0% | 58.0% | 47.0% |
| 2009 | 48.0% | 68.0% | 44.0% |
| 2008 | 33.0% | 58.0% | 41.0% |
| CST Earth Science Test | |||
| 2010 | 21.0% | 20.0% | 29.0% |
| CST English-Language Arts Test | |||
| 2010 | 35.0% | 43.0% | 45.0% |
| 2009 | 34.0% | 44.0% | 44.0% |
| 2008 | 32.0% | 39.0% | 41.0% |
| CST Geometry Test | |||
| 2010 | 8.0% | 13.0% | 14.0% |
| 2009 | 4.0% | 10.0% | 14.0% |
| 2008 | 9.0% | 13.0% | 12.0% |
| CST Science Test | |||
| 2010 | 35.0% | 47.0% | 46.0% |
| 2009 | 33.0% | 49.0% | 44.0% |
| 2008 | 27.0% | 41.0% | 40.0% |
| CST World History Test | |||
| 2010 | 32.0% | 45.0% | 42.0% |
| 2009 | 28.0% | 42.0% | 38.0% |
| 2008 | 22.0% | 34.0% | 33.0% |
Grade 11 - % of students at or above proficiency
| School | District | State | |
|---|---|---|---|
| CST Algebra I Test | |||
| 2010 | 4.0% | 3.0% | 8.0% |
| 2009 | 8.0% | 7.0% | 8.0% |
| 2008 | 1.0% | 2.0% | 5.0% |
| CST Algebra II Test | |||
| 2010 | 5.0% | 6.0% | 14.0% |
| 2009 | 9.0% | 15.0% | 12.0% |
| 2008 | 9.0% | 10.0% | 11.0% |
| CST Biology Test | |||
| 2010 | 28.0% | 34.0% | 46.0% |
| 2009 | 38.0% | 37.0% | 41.0% |
| 2008 | 33.0% | 45.0% | 39.0% |
| CST Chemistry Test | |||
| 2010 | 13.0% | 45.0% | 30.0% |
| 2009 | 10.0% | 40.0% | 27.0% |
| 2008 | 15.0% | 36.0% | 25.0% |
| CST English-Language Arts Test | |||
| 2010 | 35.0% | 41.0% | 42.0% |
| 2009 | 34.0% | 42.0% | 40.0% |
| 2008 | 35.0% | 41.0% | 37.0% |
| CST Geometry Test | |||
| 2010 | 2.0% | 2.0% | 6.0% |
| 2009 | 9.0% | 8.0% | 7.0% |
| 2008 | 4.0% | 6.0% | 6.0% |
| CST Physics Test | |||
| 2010 | 46.0% | 46.0% | 53.0% |
| 2009 | 51.0% | 51.0% | 50.0% |
| 2008 | 34.0% | 33.0% | 47.0% |
| CST Summative High School Math Test | |||
| 2010 | 36.0% | 58.0% | 50.0% |
| 2009 | 48.0% | 52.0% | 47.0% |
| 2008 | 62.0% | 47.0% | 43.0% |
| CST U.S. History Test | |||
| 2010 | 35.0% | 51.0% | 45.0% |
| 2009 | 35.0% | 48.0% | 44.0% |
| 2008 | 36.0% | 47.0% | 38.0% |
| CST World History Test | |||
| 2010 | 13.0% | 19.0% | 15.0% |
| 2009 | 27.0% | 29.0% | 11.0% |
| 2008 | 8.0% | 8.0% | 9.0% |
| CST Earth Science Test | |||
| 2009 | 39.0% | 32.0% | 26.0% |
| 2008 | 36.0% | 36.0% | 28.0% |
End of Course - % of students at or above proficiency
| School | District | State | |
|---|---|---|---|
| CST Algebra I Test | |||
| 2010 | 11.0% | 17.0% | 31.0% |
| 2009 | 7.0% | 14.0% | 28.0% |
| 2008 | 4.0% | 12.0% | 25.0% |
| CST Algebra II Test | |||
| 2010 | 15.0% | 18.0% | 31.0% |
| 2009 | 15.0% | 25.0% | 28.0% |
| 2008 | 15.0% | 19.0% | 27.0% |
| CST Biology Test | |||
| 2010 | 27.0% | 45.0% | 46.0% |
| 2009 | 25.0% | 41.0% | 42.0% |
| 2008 | 24.0% | 41.0% | 42.0% |
| CST Chemistry Test | |||
| 2010 | 22.0% | 50.0% | 38.0% |
| 2009 | 26.0% | 52.0% | 36.0% |
| 2008 | 24.0% | 46.0% | 32.0% |
| CST Earth Science Test | |||
| 2010 | 27.0% | 33.0% | 33.0% |
| 2009 | 23.0% | 32.0% | 28.0% |
| 2008 | 25.0% | 37.0% | 28.0% |
| CST General Mathematics Test | |||
| 2010 | 6.0% | 30.0% | 27.0% |
| 2009 | 9.0% | 26.0% | 26.0% |
| 2008 | 24.0% | 28.0% | 27.0% |
| CST Geometry Test | |||
| 2010 | 10.0% | 21.0% | 27.0% |
| 2009 | 14.0% | 17.0% | 26.0% |
| 2008 | 13.0% | 22.0% | 24.0% |
| CST Physics Test | |||
| 2010 | 45.0% | 45.0% | 49.0% |
| 2009 | 54.0% | 54.0% | 46.0% |
| 2008 | 30.0% | 30.0% | 43.0% |
| CST Summative High School Math Test | |||
| 2010 | 38.0% | 59.0% | 54.0% |
| 2009 | 48.0% | 53.0% | 50.0% |
| 2008 | 62.0% | 50.0% | 47.0% |
| CST World History Test | |||
| 2010 | 29.0% | 41.0% | 41.0% |
| 2009 | 28.0% | 41.0% | 38.0% |
| 2008 | 21.0% | 32.0% | 33.0% |
Source: CA Department of Education 2009-2010
School Map and Similar Schools Nearby
Click to Activate Map of Nearby School Campuses
Private
Public
This School
Similar Schools Nearby
| Cabrillo High School 9-12 | 1,508 Students | 4.5 miles away | ![]() 4.5 out of 5 | |
| Orcutt Junior High School 7-8 | 493 Students | 14.9 miles away | Not Yet Rated | |
| Ernest Righetti High School 9-12 | 2,252 Students | 16.6 miles away | Not Yet Rated | |
| Lakeview Junior High School 7-8 | 610 Students | 16.8 miles away | Not Yet Rated | |
| Arellanes Junior High School 7-8 | 539 Students | 17.1 miles away | Not Yet Rated | |
| Santa Ynez Valley Union High School 9-12 | 1,080 Students | 21.0 miles away | Not Yet Rated | |
| El Camino Junior High School 7-8 | 639 Students | 21.5 miles away | Not Yet Rated | |
| Kermit Mckenzie Junior High School 6-8 | 359 Students | 22.2 miles away | Not Yet Rated | |
| Tommie Kunst Junior High School 7-8 | 775 Students | 23.3 miles away | Not Yet Rated | |
| Nipomo High School 9-12 | 1,132 Students | 28.0 miles away | ![]() 5 out of 5 | |
Compare This School To Nearby Schools ->
School Community Forum

Join a discussion about Lompoc High School and talk to others in the community including students, parents, teachers, and administrators.
Popular Discussion Topics
- Admissions and Registration Questions (e.g. Dress Code and Discipline Policy)
- School Calendar and Upcoming Events (e.g. Graduation)
- After School Programs, Extracurricular Activities, and Athletics (e.g. Football)
- News and Announcements (e.g. Yearbook and Class Supply List Details)
- Graduate and Alumni Events (e.g. Organizing Class Reunions)
Navigation
Can't Find What You Are Looking For?
Rankings
Nearby Cities
Sponsored Links
K-12 Articles
What to Do when Your Student is Held Back
Kids develop at different speeds, and everyone has different skills and abilities. School is easy...
Is Your Child's Teacher a Bully?
We've all heard about kids being bullied by peers. Kids taunt, tease, pull hair, shove and push...
Is Your Child Happy at School?
As a parent, you'd love to have your child share all of his feelings with you. It would be so easy...


(5 / 5) 
