Stickleyville Elementary School
Rating
Not Available
Not Available

No Reviews Yet
Find Old Friends From Stickleyville Elementary School
Use the form below to search for alumni from Stickleyville Elementary School.
School Description
School Summary and Highlights
- Enrolls 94 preschool and elementary school students from grades PK-7
- Ranks 457th out of 1,149 elementary schools in VA.
Additional Contact Information
- Mailing Address: Rt 1 Box 141s, Duffield, VA 24244
School Operational Details
- Title I EligibleAll students of this school are eligible for participation in authorized programs.
School District Details
- Lee County Public Schools District
- Per-Pupil Spending: $11,127
- Graduation Rate: 57.7%
- Dropout Rate: 4.2%
- Students Per Teacher: 17.8
- Enrolled Students: 3,651
Faculty Details and Student Enrollment
Students and Faculty
- Total Students Enrolled: 94
- Total Full Time "Equivalent" Teachers: 9.1
- Average Student-To-Teacher Ratio: 10.3
Students Gender Breakdown
- Males: 56 (59.6%)
- Females: 38 (40.4%)
Free Lunch Student Eligibility Breakdown
- Eligible for Reduced Lunch: 5 (5.3%)
- Eligible for Free Lunch: 26 (27.7%)
- Eligible for Either Reduced or Free Lunch: 31 (33.0%)
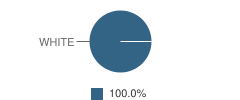
Student Enrollment Distribution by Race / Ethnicity
| Number | Percent | |
|---|---|---|
| American Indian | - | - |
| Black | - | - |
| Asian | - | - |
| Hispanic | - | - |
| White | 94 | 100.0% |
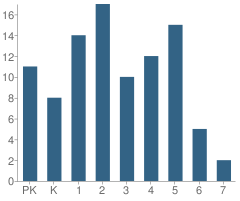
Number of Students Per Grade
| Number | Percent | |
|---|---|---|
| Pre-Kindergarten | 11 | 11.7% |
| Kindergarten | 8 | 8.5% |
| 1st Grade | 14 | 14.9% |
| 2nd Grade | 17 | 18.1% |
| 3rd Grade | 10 | 10.6% |
| 4th Grade | 12 | 12.8% |
| 5th Grade | 15 | 16.0% |
| 6th Grade | 5 | 5.3% |
| 7th Grade | 2 | 2.1% |
Source: VA Department of Education, Source: NCES 2009-2010
School Ratings and Reviews
Be The First To Review Stickleyville Elementary School!
School Map and Similar Schools Nearby
Click to Activate Map of Nearby School Campuses
Private
Public
This School
Similar Schools Nearby
| Elk Knob Elementary School PK-5 | 380 Students | 0.09 miles away | Not Yet Rated | |
| Dryden Primary School PK-5 | 344 Students | 4.9 miles away | Not Yet Rated | |
| St. Charles Elementary School PK-7 | 169 Students | 8.4 miles away | Not Yet Rated | |
| Duffield-Pattonsville Primary School PK-4 | 343 Students | 8.8 miles away | Not Yet Rated | |
| Keokee Elementary School PK-7 | 78 Students | 9.4 miles away | Not Yet Rated | |
| Flatwoods Primary School PK-5 | 413 Students | 14.0 miles away | Not Yet Rated | |
| Rye Cove Int. School 5-7 | 192 Students | 15.0 miles away | Not Yet Rated | |
| Powell Valley Primary School PK-4 | 733 Students | 17.1 miles away | Not Yet Rated | |
| Powell Valley Middle School 5-8 | 520 Students | 17.4 miles away | Not Yet Rated | |
| Yuma Elementary School PK-6 | 190 Students | 19.5 miles away |  5 out of 5 | |
Compare This School To Nearby Schools ->
Navigation
Can't Find What You Are Looking For?
Rankings
Nearby Cities
Sponsored Links
K-12 Articles

Attend Your Teen's Holiday Parties
Christmas and New Years are coming, and with them Christmas and New Years Eve parties. At many of...
Christmas and New Years are coming, and with them Christmas and New Years Eve parties. At many of...

Strategies to Help Kids Cope with Stress
Many parents believe that kids don't experience stress. Nothing could be further from the truth....
Many parents believe that kids don't experience stress. Nothing could be further from the truth....

Teaching Your Child Study Skills
Many children who have the capability to get good grades experience frustration because of low...
Many children who have the capability to get good grades experience frustration because of low...