Sugarland Elementary School
Rating
Not Available
Not Available

No Reviews Yet
Find Old Friends From Sugarland Elementary School
Use the form below to search for alumni from Sugarland Elementary School.
School Description
School Summary and Highlights
- Enrolls 510 preschool and elementary school students from grades PK-5
- Ranks 1133rd out of 1,149 elementary schools in VA.
School Operational Details
- Title I Eligible
School District Details
- Loudoun County Public Schools District
- Per-Pupil Spending: $13,172
- Graduation Rate: 95.9%
- Dropout Rate: 1.1%
- Students Per Teacher: 18.1
- Enrolled Students: 60,003
Faculty Details and Student Enrollment
Students and Faculty
- Total Students Enrolled: 510
- Total Full Time "Equivalent" Teachers: 37.3
- Average Student-To-Teacher Ratio: 13.7
Students Gender Breakdown
- Males: 269 (52.7%)
- Females: 216 (42.4%)
Free Lunch Student Eligibility Breakdown
- Eligible for Reduced Lunch: 71 (13.9%)
- Eligible for Free Lunch: 234 (45.9%)
- Eligible for Either Reduced or Free Lunch: 305 (59.8%)
Student Enrollment Distribution by Race / Ethnicity
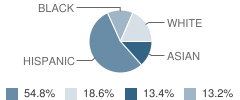
| Number | Percent | |
|---|---|---|
| American Indian | - | - |
| Black | 64 | 12.5% |
| Asian | 65 | 12.7% |
| Hispanic | 266 | 52.2% |
| White | 90 | 17.6% |
Number of Students Per Grade
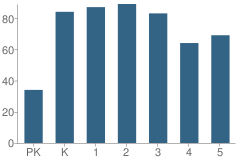
| Number | Percent | |
|---|---|---|
| Pre-Kindergarten | 34 | 6.7% |
| Kindergarten | 84 | 16.5% |
| 1st Grade | 87 | 17.1% |
| 2nd Grade | 89 | 17.5% |
| 3rd Grade | 83 | 16.3% |
| 4th Grade | 64 | 12.5% |
| 5th Grade | 69 | 13.5% |
Source: VA Department of Education, Source: NCES 2009-2010
School Ratings and Reviews
Be The First To Review Sugarland Elementary School!
School Map and Similar Schools Nearby
Click to Activate Map of Nearby School Campuses
Private
Public
This School
Similar Schools Nearby
| Horizon Elementary School PK-5 | 786 Students | 0.6 miles away | Not Yet Rated | |
| Meadowland Elementary School PK-5 | 422 Students | 0.6 miles away | Not Yet Rated | |
| Potowmack Elementary School PK-5 | 629 Students | 0.7 miles away | Not Yet Rated | |
| Dominion High School PK-12 | 1,298 Students | 0.9 miles away |  3 out of 5 | |
| Rolling Ridge Elementary School PK-5 | 550 Students | 1.5 miles away | Not Yet Rated | |
| Countryside Elementary School PK-5 | 656 Students | 1.7 miles away | Not Yet Rated | |
| Lowes Island Elementary School PK-5 | 689 Students | 1.8 miles away | Not Yet Rated | |
| Algonkian Elementary School PK-5 | 446 Students | 2.0 miles away |  5 out of 5 | |
| Sterling Elementary School PK-5 | 533 Students | 2.2 miles away | Not Yet Rated | |
| Dranesville Elementary School PK-6 | 622 Students | 2.8 miles away | Not Yet Rated | |
Compare This School To Nearby Schools ->
School Community Forum

Join a discussion about Sugarland Elementary School and talk to others in the community including students, parents, teachers, and administrators.
Popular Discussion Topics
- Admissions and Registration Questions (e.g. Dress Code and Discipline Policy)
- School Calendar and Upcoming Events (e.g. Graduation)
- After School Programs, Extracurricular Activities, and Athletics (e.g. Football)
- News and Announcements (e.g. Yearbook and Class Supply List Details)
- Graduate and Alumni Events (e.g. Organizing Class Reunions)
Navigation
Can't Find What You Are Looking For?
Rankings
Nearby Cities
Sponsored Links
K-12 Articles

The Pros and Cons of Seat Belts in School Buses
Recently the news has been full of school bus accidents where children have been seriously injured...
Recently the news has been full of school bus accidents where children have been seriously injured...

The Cervical Cancer Vaccine
All across North America girls between the ages of 11 and 12 have the opportunity to be vaccinated...
All across North America girls between the ages of 11 and 12 have the opportunity to be vaccinated...

What to Do when Your Student is Held Back
Kids develop at different speeds, and everyone has different skills and abilities. School is easy...
Kids develop at different speeds, and everyone has different skills and abilities. School is easy...