Kenbridge Elementary School
Rating
Not Available
Not Available

5 out of 5 | 1 Review
Find Old Friends From Kenbridge Elementary School
Use the form below to search for alumni from Kenbridge Elementary School.
School Description
School Summary and Highlights
- Enrolls 344 preschool and elementary school students from grades PK-5
- Ranks 412th out of 1,149 elementary schools in VA.
Additional Contact Information
- Mailing Address: PO Box 907, Kenbridge, VA 23944
School Operational Details
- Title I EligibleAll students of this school are eligible for participation in authorized programs.
School District Details
- Lunenburg County Public Schools District
- Per-Pupil Spending: $9,640
- Graduation Rate: 57.1%
- Dropout Rate: 6.0%
- Students Per Teacher: 18.3
- Enrolled Students: 1,648
Faculty Details and Student Enrollment
Students and Faculty
- Total Students Enrolled: 344
- Total Full Time "Equivalent" Teachers: 23.0
- Average Student-To-Teacher Ratio: 15.0
Students Gender Breakdown
- Males: 179 (52.0%)
- Females: 150 (43.6%)
Free Lunch Student Eligibility Breakdown
- Eligible for Reduced Lunch: 23 (6.7%)
- Eligible for Free Lunch: 198 (57.6%)
- Eligible for Either Reduced or Free Lunch: 221 (64.2%)
Student Enrollment Distribution by Race / Ethnicity
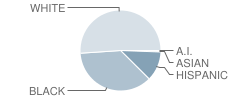
| Number | Percent | |
|---|---|---|
| American Indian | 1 | 0.3% |
| Black | 120 | 34.9% |
| Asian | 1 | 0.3% |
| Hispanic | 39 | 11.3% |
| White | 168 | 48.8% |
Number of Students Per Grade
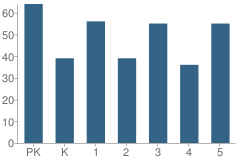
| Number | Percent | |
|---|---|---|
| Pre-Kindergarten | 64 | 18.6% |
| Kindergarten | 39 | 11.3% |
| 1st Grade | 56 | 16.3% |
| 2nd Grade | 39 | 11.3% |
| 3rd Grade | 55 | 16.0% |
| 4th Grade | 36 | 10.5% |
| 5th Grade | 55 | 16.0% |
Source: VA Department of Education, Source: NCES 2009-2010
School Ratings and Reviews
Overall Rating: 5

5 out of 5 | 1 Review
The Overall Rating is the school's average rating from parents, students, school faculty and staff. The highest rating is five apples and the lowest is one apple.
Share Your Review About This School
1 review for Kenbridge Elementary School
- Reviewed by Parent/Guardian on January 21, 2010
- Rating:
 (5 / 5) Flag as inappropriate
 - I just get so excited when it is time for school to start. Not only because the kids go back , but because the teachers are just great. My daughter loves all her teachers . And i like the one on one they do.
School Map and Similar Schools Nearby
Click to Activate Map of Nearby School Campuses
Private
Public
This School
Similar Schools Nearby
| Victoria Elementary School KG-5 | 462 Students | 6.0 miles away |  5 out of 5 | |
| Blackstone Primary School PK-4 | 571 Students | 9.9 miles away | Not Yet Rated | |
| Nottoway Intermediate School 5-6 | 341 Students | 11.2 miles away | Not Yet Rated | |
| Crewe Primary School PK-4 | 291 Students | 13.4 miles away | Not Yet Rated | |
| Red Oak Elementary School PK-5 | 231 Students | 14.2 miles away | Not Yet Rated | |
| Burkeville Elementary School PK-4 | 168 Students | 15.3 miles away | Not Yet Rated | |
| South Hill Elementary School PK-5 | 699 Students | 17.3 miles away | Not Yet Rated | |
| Totaro Elementary School PK-5 | 500 Students | 19.0 miles away | Not Yet Rated | |
| Lacrosse Elementary School PK-5 | 341 Students | 20.2 miles away | 5 out of 5 | |
| Buckhorn Elementary School PK-5 | 270 Students | 20.4 miles away | 5 out of 5 | |
Compare This School To Nearby Schools ->
School Community Forum

Join a discussion about Kenbridge Elementary School and talk to others in the community including students, parents, teachers, and administrators.
Popular Discussion Topics
- Admissions and Registration Questions (e.g. Dress Code and Discipline Policy)
- School Calendar and Upcoming Events (e.g. Graduation)
- After School Programs, Extracurricular Activities, and Athletics (e.g. Football)
- News and Announcements (e.g. Yearbook and Class Supply List Details)
- Graduate and Alumni Events (e.g. Organizing Class Reunions)
Navigation
Can't Find What You Are Looking For?
Rankings
Nearby Cities
Sponsored Links
K-12 Articles

Where in the World is Carmen Sandiego?
One of the sensations on YouTube highlights the state of our education system. The spot was...
One of the sensations on YouTube highlights the state of our education system. The spot was...

Is Your Child's Teacher a Bully?
We've all heard about kids being bullied by peers. Kids taunt, tease, pull hair, shove and push...
We've all heard about kids being bullied by peers. Kids taunt, tease, pull hair, shove and push...

The Importance of Reading for Children Preschool to Grade Three
The first teachers of children are their parents. From the time they are infants, children need to...
The first teachers of children are their parents. From the time they are infants, children need to...