Paul L. Dunbar Middle for Innovation School
Rating
Not Available
Not Available

5 out of 5 | 5 Reviews
Find Old Friends From Paul L. Dunbar Middle for Innovation School
Use the form below to search for alumni from Paul L. Dunbar Middle for Innovation School.
School Description
School Summary and Highlights
- Enrolls 627 middle school students from grades 6-8
- Ranks 377th out of 419 middle schools in VA.
School Operational Details
- Magnet School
School District Details
- Lynchburg City Public Schools District
- Per-Pupil Spending: $10,485
- Graduation Rate: 69.4%
- Dropout Rate: 4.3%
- Students Per Teacher: 15.7
- Enrolled Students: 8,597
Faculty Details and Student Enrollment
Students and Faculty
- Total Students Enrolled: 627
- Total Full Time "Equivalent" Teachers: 44.5
- Average Student-To-Teacher Ratio: 14.1
Students Gender Breakdown
- Males: 299 (47.7%)
- Females: 309 (49.3%)
Free Lunch Student Eligibility Breakdown
- Eligible for Reduced Lunch: 63 (10.0%)
- Eligible for Free Lunch: 363 (57.9%)
- Eligible for Either Reduced or Free Lunch: 426 (67.9%)
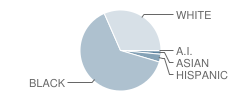
Student Enrollment Distribution by Race / Ethnicity
| Number | Percent | |
|---|---|---|
| American Indian | 1 | 0.2% |
| Black | 388 | 61.9% |
| Asian | 8 | 1.3% |
| Hispanic | 19 | 3.0% |
| White | 192 | 30.6% |
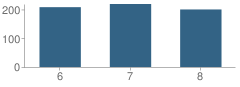
Number of Students Per Grade
| Number | Percent | |
|---|---|---|
| 6th Grade | 208 | 33.2% |
| 7th Grade | 219 | 34.9% |
| 8th Grade | 200 | 31.9% |
Source: VA Department of Education, Source: NCES 2009-2010
School Ratings and Reviews
Overall Rating: 5

5 out of 5 | 5 Reviews
The Overall Rating is the school's average rating from parents, students, school faculty and staff. The highest rating is five apples and the lowest is one apple.
Share Your Review About This School
5 reviews for Paul L. Dunbar Middle for Innovation School
- Reviewed by Teacher on June 09, 2011
- Rating:
 (5 / 5) Flag as inappropriate
 - This is the best school I have ever worked for! Dunbar is an excellent school with the most dedicated and innovative teachers in Lynchburg. We have an excellent theater program, an award winning band and orchestra, and one of the only middle school herpetology labs in the country. (I love the touch tank!) Our basketball team was undefeated last year and we had over 200 students enter writing competitions. This middle school has everything. it is truly innovative. The best thing about the school though is the atmosphere and the friendliness. Everyone seems happy to be here! P.L. Dunbar is an excellent school.
- Reviewed by Community Member on August 08, 2010
- Rating: (5 / 5) Flag as inappropriate
- great school!
- Reviewed by Parent/Guardian on January 14, 2009
- Rating: (5 / 5) Flag as inappropriate
- This school is awesome! My child has excelled thanks to the great staff and faculty.
- Reviewed by Student on September 29, 2007
- Rating: (5 / 5) Flag as inappropriate
- i love this school
- Reviewed by Student on March 02, 2007
- Rating: (5 / 5) Flag as inappropriate
- I liked this school.It was a great school with alot of nice teachers and staff members. Thank you for the education oppertunity.
School Map and Similar Schools Nearby
Click to Activate Map of Nearby School Campuses
Private
Public
This School
Similar Schools Nearby
| Linkhorne Middle School 6-8 | 636 Students | 3.2 miles away | Not Yet Rated | |
| Sandusky Middle School 6-8 | 535 Students | 3.5 miles away |  5 out of 5 | |
| Monelison Middle School 6-8 | 641 Students | 3.8 miles away |  3 out of 5 | |
| Brookville Middle School 6-8 | 732 Students | 6.8 miles away |  4 out of 5 | |
| Forest Middle School 6-8 | 1,024 Students | 9.3 miles away | Not Yet Rated | |
| Rustburg Middle School 6-8 | 644 Students | 9.5 miles away | Not Yet Rated | |
| Amherst Middle School 6-8 | 416 Students | 12.9 miles away |  1 out of 5 | |
| Big Island Elementary School PK-6 | 216 Students | 17.1 miles away | Not Yet Rated | |
| Appomattox Middle School 6-8 | 541 Students | 18.0 miles away | Not Yet Rated | |
| Bedford Middle School 7-8 | 472 Students | 21.1 miles away | Not Yet Rated | |
Compare This School To Nearby Schools ->
School Community Forum

Join a discussion about Paul L. Dunbar Middle for Innovation School and talk to others in the community including students, parents, teachers, and administrators.
Popular Discussion Topics
- Admissions and Registration Questions (e.g. Dress Code and Discipline Policy)
- School Calendar and Upcoming Events (e.g. Graduation)
- After School Programs, Extracurricular Activities, and Athletics (e.g. Football)
- News and Announcements (e.g. Yearbook and Class Supply List Details)
- Graduate and Alumni Events (e.g. Organizing Class Reunions)
Navigation
Can't Find What You Are Looking For?
Rankings
Nearby Cities
Sponsored Links
K-12 Articles

Adolescents, Sleep and Learning
Recently, adolescent's sleep habits have been in the news. Research has shown that adolescents need...
Recently, adolescent's sleep habits have been in the news. Research has shown that adolescents need...

The Difference Between Boys and Girls
Boys and girls are different. Give a toddler girl a G.I. Joe and she'll probably try to mother it....
Boys and girls are different. Give a toddler girl a G.I. Joe and she'll probably try to mother it....

Teaching Your Kids About Respect, Values and Violence
These days it seems that every newscast reports at least once incident of violence. As parents, we...
These days it seems that every newscast reports at least once incident of violence. As parents, we...