Sheffield Elementary School
Rating
Not Available
Not Available

No Reviews Yet
Find Old Friends From Sheffield Elementary School
Use the form below to search for alumni from Sheffield Elementary School.
School Description
School Summary and Highlights
- Enrolls 406 preschool and elementary school students from grades PK-5
- Ranks 735th out of 1,149 elementary schools in VA.
School Operational Details
- Title I EligibleAll students of this school are eligible for participation in authorized programs.
School District Details
- Lynchburg City Public Schools District
- Per-Pupil Spending: $10,485
- Graduation Rate: 69.4%
- Dropout Rate: 4.3%
- Students Per Teacher: 15.7
- Enrolled Students: 8,597
Faculty Details and Student Enrollment
Students and Faculty
- Total Students Enrolled: 406
- Total Full Time "Equivalent" Teachers: 28.1
- Average Student-To-Teacher Ratio: 14.5
Students Gender Breakdown
- Males: 190 (46.8%)
- Females: 186 (45.8%)
Free Lunch Student Eligibility Breakdown
- Eligible for Reduced Lunch: 26 (6.4%)
- Eligible for Free Lunch: 234 (57.6%)
- Eligible for Either Reduced or Free Lunch: 260 (64.0%)
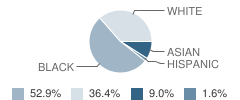
Student Enrollment Distribution by Race / Ethnicity
| Number | Percent | |
|---|---|---|
| American Indian | - | - |
| Black | 199 | 49.0% |
| Asian | 34 | 8.4% |
| Hispanic | 6 | 1.5% |
| White | 137 | 33.7% |
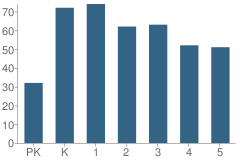
Number of Students Per Grade
| Number | Percent | |
|---|---|---|
| Pre-Kindergarten | 32 | 7.9% |
| Kindergarten | 72 | 17.7% |
| 1st Grade | 74 | 18.2% |
| 2nd Grade | 62 | 15.3% |
| 3rd Grade | 63 | 15.5% |
| 4th Grade | 52 | 12.8% |
| 5th Grade | 51 | 12.6% |
Source: VA Department of Education, Source: NCES 2009-2010
School Ratings and Reviews
Be The First To Review Sheffield Elementary School!
School Map and Similar Schools Nearby
Click to Activate Map of Nearby School Campuses
Private
Public
This School
Similar Schools Nearby
| Heritage Elementary School PK-5 | 502 Students | 1.0 miles away | Not Yet Rated | |
| Sandusky Elementary School PK-5 | 326 Students | 1.3 miles away |  3 out of 5 | |
| Perrymont Elementary School PK-5 | 346 Students | 1.6 miles away | Not Yet Rated | |
| T.c. Miller Elementary for Innovation School KG-5 | 229 Students | 2.5 miles away | Not Yet Rated | |
| Tomahawk Elementary School PK-5 | 622 Students | 3.0 miles away |  5 out of 5 | |
| William M. Bass Elementary School PK-5 | 245 Students | 3.1 miles away | Not Yet Rated | |
| Robert S. Payne Elementary School PK-5 | 579 Students | 3.5 miles away |  4.5 out of 5 | |
| Linkhorne Elementary School PK-5 | 527 Students | 3.5 miles away | 5 out of 5 | |
| Dearington Elementary for Innovation School PK-5 | 226 Students | 3.6 miles away | 5 out of 5 | |
| Leesville Road Elementary School PK-5 | 686 Students | 3.9 miles away | 5 out of 5 | |
Compare This School To Nearby Schools ->
School Community Forum

Join a discussion about Sheffield Elementary School and talk to others in the community including students, parents, teachers, and administrators.
Popular Discussion Topics
- Admissions and Registration Questions (e.g. Dress Code and Discipline Policy)
- School Calendar and Upcoming Events (e.g. Graduation)
- After School Programs, Extracurricular Activities, and Athletics (e.g. Football)
- News and Announcements (e.g. Yearbook and Class Supply List Details)
- Graduate and Alumni Events (e.g. Organizing Class Reunions)
Navigation
Can't Find What You Are Looking For?
Rankings
Nearby Cities
Sponsored Links
K-12 Articles

The Cervical Cancer Vaccine
All across North America girls between the ages of 11 and 12 have the opportunity to be vaccinated...
All across North America girls between the ages of 11 and 12 have the opportunity to be vaccinated...

It's the Most Wonderful Time of the Year!
For most of the country, school is starting up this week or later this month-at the beginning of...
For most of the country, school is starting up this week or later this month-at the beginning of...

Helping Your Child Leave the Nest
It's all come down to this: Eighteen years of good times and bad, and now your baby bird is ready...
It's all come down to this: Eighteen years of good times and bad, and now your baby bird is ready...