Cubberley Elementary School
Rating
Not Available
Not Available

5 out of 5 | 1 Review
Find Old Friends From Cubberley Elementary School
Use the form below to search for alumni from Cubberley Elementary School.
School Description
School Summary and Highlights
- Enrolls 1,010 elementary school students from grades KG-8
- Ranks 322nd out of 2,050 middle schools in CA.
- 2010 Overall School AYP Met Status: No
Additional Contact Information
- Mailing Address: 3200 Monogram Ave., Long Beach, CA 90808
School District Details
- Long Beach Unified School District
- Per-Pupil Spending: $9,646
- Graduation Rate: 65.5%
- Dropout Rate: 4.1%
- Students Per Teacher: 22.0
- Enrolled Students: 86,089
Faculty Details and Student Enrollment
Students and Faculty
- Total Students Enrolled: 1,010
- Total Full Time "Equivalent" Teachers: 47.0
- Average Student-To-Teacher Ratio: 21.5
Students Gender Breakdown
- Males: 501 (49.6%)
- Females: 509 (50.4%)
Free Lunch Student Eligibility Breakdown
- Eligible for Reduced Lunch: 64 (6.3%)
- Eligible for Free Lunch: 160 (15.8%)
- Eligible for Either Reduced or Free Lunch: 224 (22.2%)
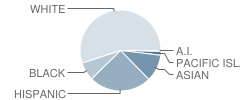
Student Enrollment Distribution by Race / Ethnicity
| Number | Percent | |
|---|---|---|
| American Indian | 5 | 0.5% |
| Black | 71 | 7.0% |
| Asian | 104 | 10.3% |
| Hispanic | 239 | 23.7% |
| White | 525 | 52.0% |
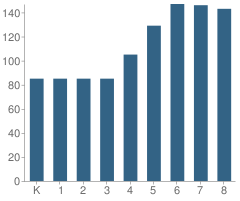
Number of Students Per Grade
| Number | Percent | |
|---|---|---|
| Kindergarten | 85 | 8.4% |
| 1st Grade | 85 | 8.4% |
| 2nd Grade | 85 | 8.4% |
| 3rd Grade | 85 | 8.4% |
| 4th Grade | 105 | 10.4% |
| 5th Grade | 129 | 12.8% |
| 6th Grade | 147 | 14.6% |
| 7th Grade | 146 | 14.5% |
| 8th Grade | 143 | 14.2% |
Teacher Education Background (2009)
Percent With Ph.D.
School:
5.2%
District:
4.9%
Percent With Master's Degree
School:
39.7%
District:
28.5%
Percent With Bachelor's Degree
School:
3.4%
District:
70.4%
Teacher Credentials & Experience (2009)
Percent of Teachers With Emergency Credentials: 2.0%
Percent of Teachers With Credentials: 98.0%
Number of Certificated Staff: 58.0
Average Number of Years of Teacher Experience: 17.6
Average Age
School:
44.4
District:
44.2
Source: CA Department of Education, Source: NCES 2009-2010
School Ratings and Reviews
Overall Rating: 5

5 out of 5 | 1 Review
The Overall Rating is the school's average rating from parents, students, school faculty and staff. The highest rating is five apples and the lowest is one apple.
Share Your Review About This School
1 review for Cubberley Elementary School
- Reviewed by Parent/Guardian on October 28, 2008
- Rating:
 (5 / 5) Flag as inappropriate
 - this school is a fantastic teaching and learning environment.
teachers are the best not only education wise but also in a friend ship manner. i recomend this school to any one who can get in. . .
thank you cubberly for the great experiance i got!
School Map and Similar Schools Nearby
Click to Activate Map of Nearby School Campuses
Private
Public
This School
Similar Schools Nearby
| Keller Elementary School KG-5 | 519 Students | 0.8 miles away | Not Yet Rated | |
| Henry Elementary School KG-5 | 479 Students | 0.8 miles away |  5 out of 5 | |
| Prisk Elementary School KG-5 | 523 Students | 1.2 miles away | 5 out of 5 | |
| Burcham Elementary School KG-8 | 546 Students | 1.3 miles away | Not Yet Rated | |
| Newcomb Elementary School KG-8 | 932 Students | 1.4 miles away |  4.5 out of 5 | |
| Carver Elementary School KG-5 | 410 Students | 1.5 miles away | Not Yet Rated | |
| Monroe Elementary School KG-8 | 915 Students | 1.5 miles away | Not Yet Rated | |
| Venn W. Furgeson Elementary School KG-6 | 427 Students | 1.7 miles away | Not Yet Rated | |
| Richard Henry Lee Elementary School KG-5 | 622 Students | 1.7 miles away | Not Yet Rated | |
| Aloha Elementary School KG-6 | 412 Students | 1.8 miles away | Not Yet Rated | |
Compare This School To Nearby Schools ->
School Community Forum

Join a discussion about Cubberley Elementary School and talk to others in the community including students, parents, teachers, and administrators.
Popular Discussion Topics
- Admissions and Registration Questions (e.g. Dress Code and Discipline Policy)
- School Calendar and Upcoming Events (e.g. Graduation)
- After School Programs, Extracurricular Activities, and Athletics (e.g. Football)
- News and Announcements (e.g. Yearbook and Class Supply List Details)
- Graduate and Alumni Events (e.g. Organizing Class Reunions)
Navigation
Can't Find What You Are Looking For?
Rankings
Nearby Cities
Sponsored Links
K-12 Articles

Strategies to Help Kids Cope with Stress
Many parents believe that kids don’t experience stress. Nothing could be further from the truth....
Many parents believe that kids don’t experience stress. Nothing could be further from the truth....

Idle Hands
The worst affliction affecting our kids today is not teen pregnancy, drugs and alcohol, or...
The worst affliction affecting our kids today is not teen pregnancy, drugs and alcohol, or...

Teaching Kids to Deal with Peer Pressure
Parents usually become very concerned when they hear the term “peer pressure.” However, peer...
Parents usually become very concerned when they hear the term “peer pressure.” However, peer...