Lee Hall Elementary School
Rating
Not Available
Not Available

No Reviews Yet
Find Old Friends From Lee Hall Elementary School
Use the form below to search for alumni from Lee Hall Elementary School.
School Description
School Summary and Highlights
- Enrolls 706 preschool and elementary school students from grades PK-5
- Ranks 929th out of 1,149 elementary schools in VA.
School Operational Details
- Title I EligibleAll students of this school are eligible for participation in authorized programs.
School District Details
- Newport News City Public Schools District
- Per-Pupil Spending: $10,032
- Graduation Rate: 66.5%
- Dropout Rate: 3.2%
- Students Per Teacher: 17.9
- Enrolled Students: 30,869
Faculty Details and Student Enrollment
Students and Faculty
- Total Students Enrolled: 706
- Total Full Time "Equivalent" Teachers: 48.2
- Average Student-To-Teacher Ratio: 14.6
Students Gender Breakdown
- Males: 347 (49.2%)
- Females: 316 (44.8%)
Free Lunch Student Eligibility Breakdown
- Eligible for Reduced Lunch: 85 (12.0%)
- Eligible for Free Lunch: 282 (39.9%)
- Eligible for Either Reduced or Free Lunch: 367 (52.0%)
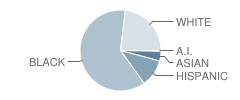
Student Enrollment Distribution by Race / Ethnicity
| Number | Percent | |
|---|---|---|
| American Indian | 2 | 0.3% |
| Black | 410 | 58.1% |
| Asian | 26 | 3.7% |
| Hispanic | 72 | 10.2% |
| White | 153 | 21.7% |
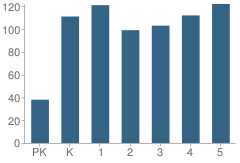
Number of Students Per Grade
| Number | Percent | |
|---|---|---|
| Pre-Kindergarten | 38 | 5.4% |
| Kindergarten | 111 | 15.7% |
| 1st Grade | 121 | 17.1% |
| 2nd Grade | 99 | 14.0% |
| 3rd Grade | 103 | 14.6% |
| 4th Grade | 112 | 15.9% |
| 5th Grade | 122 | 17.3% |
Source: VA Department of Education, Source: NCES 2009-2010
School Ratings and Reviews
Be The First To Review Lee Hall Elementary School!
School Map and Similar Schools Nearby
Click to Activate Map of Nearby School Campuses
Private
Public
This School
Similar Schools Nearby
| James River Elementary School KG-5 | 485 Students | 2.9 miles away |  5 out of 5 | |
| Oliver C. Greenwood Elementary School PK-5 | 655 Students | 3.3 miles away | Not Yet Rated | |
| David A. Dutrow Elementary School PK-5 | 490 Students | 3.4 miles away |  3.5 out of 5 | |
| Richneck Elementary School PK-5 | 710 Students | 3.4 miles away | Not Yet Rated | |
| George J. Mcintosh Elementary School PK-5 | 494 Students | 3.7 miles away | Not Yet Rated | |
| Yorktown Elementary School KG-5 | 601 Students | 3.9 miles away | Not Yet Rated | |
| Horace H. Epes Elementary School PK-5 | 570 Students | 4.1 miles away | Not Yet Rated | |
| R. O. Nelson Elementary School PK-5 | 563 Students | 4.2 miles away | Not Yet Rated | |
| T. Ryland Sanford Elementary School PK-5 | 569 Students | 5.6 miles away | Not Yet Rated | |
| Willis A. Jenkins Elementary School PK-5 | 372 Students | 6.1 miles away | Not Yet Rated | |
Compare This School To Nearby Schools ->
School Community Forum

Join a discussion about Lee Hall Elementary School and talk to others in the community including students, parents, teachers, and administrators.
Popular Discussion Topics
- Admissions and Registration Questions (e.g. Dress Code and Discipline Policy)
- School Calendar and Upcoming Events (e.g. Graduation)
- After School Programs, Extracurricular Activities, and Athletics (e.g. Football)
- News and Announcements (e.g. Yearbook and Class Supply List Details)
- Graduate and Alumni Events (e.g. Organizing Class Reunions)
Navigation
Can't Find What You Are Looking For?
Rankings
Nearby Cities
Sponsored Links
K-12 Articles

Homework Helps
School has started throughout the country and is well into the first month-some schools are...
School has started throughout the country and is well into the first month-some schools are...

Help Your Child Achieve Success in Middle School
Middle school is for children between the ages of 10 and 14 years. At this time children begin to...
Middle school is for children between the ages of 10 and 14 years. At this time children begin to...

Preparing Your Child for the First Day of School
It seems like school was just dismissed for the summer, yet here we are facing another year of back...
It seems like school was just dismissed for the summer, yet here we are facing another year of back...