Richneck Elementary School
Rating
Not Available
Not Available

No Reviews Yet
Find Old Friends From Richneck Elementary School
Use the form below to search for alumni from Richneck Elementary School.
School Description
School Summary and Highlights
- Enrolls 710 preschool and elementary school students from grades PK-5
- Ranks 900th out of 1,149 elementary schools in VA.
Additional Contact Information
- Mailing Address: 205 Tyner Drive, Newport News, VA 23608
School District Details
- Newport News City Public Schools District
- Per-Pupil Spending: $10,032
- Graduation Rate: 66.5%
- Dropout Rate: 3.2%
- Students Per Teacher: 17.9
- Enrolled Students: 30,869
Faculty Details and Student Enrollment
Students and Faculty
- Total Students Enrolled: 710
- Total Full Time "Equivalent" Teachers: 32.8
- Average Student-To-Teacher Ratio: 21.7
Students Gender Breakdown
- Males: 367 (51.7%)
- Females: 305 (43.0%)
Free Lunch Student Eligibility Breakdown
- Eligible for Reduced Lunch: 68 (9.6%)
- Eligible for Free Lunch: 214 (30.1%)
- Eligible for Either Reduced or Free Lunch: 282 (39.7%)
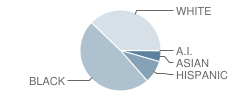
Student Enrollment Distribution by Race / Ethnicity
| Number | Percent | |
|---|---|---|
| American Indian | 1 | 0.1% |
| Black | 327 | 46.1% |
| Asian | 29 | 4.1% |
| Hispanic | 61 | 8.6% |
| White | 254 | 35.8% |
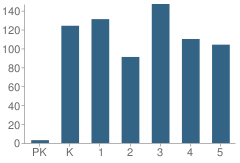
Number of Students Per Grade
| Number | Percent | |
|---|---|---|
| Pre-Kindergarten | 3 | 0.4% |
| Kindergarten | 124 | 17.5% |
| 1st Grade | 131 | 18.5% |
| 2nd Grade | 91 | 12.8% |
| 3rd Grade | 147 | 20.7% |
| 4th Grade | 110 | 15.5% |
| 5th Grade | 104 | 14.6% |
Source: VA Department of Education, Source: NCES 2009-2010
School Ratings and Reviews
Be The First To Review Richneck Elementary School!
School Map and Similar Schools Nearby
Click to Activate Map of Nearby School Campuses
Private
Public
This School
Similar Schools Nearby
| Oliver C. Greenwood Elementary School PK-5 | 655 Students | 0.3 miles away | Not Yet Rated | |
| George J. Mcintosh Elementary School PK-5 | 494 Students | 0.6 miles away | Not Yet Rated | |
| David A. Dutrow Elementary School PK-5 | 490 Students | 1.7 miles away |  3.5 out of 5 | |
| Horace H. Epes Elementary School PK-5 | 570 Students | 2.1 miles away | Not Yet Rated | |
| R. O. Nelson Elementary School PK-5 | 563 Students | 2.9 miles away | Not Yet Rated | |
| Willis A. Jenkins Elementary School PK-5 | 372 Students | 3.3 miles away | Not Yet Rated | |
| T. Ryland Sanford Elementary School PK-5 | 569 Students | 3.3 miles away | Not Yet Rated | |
| Yorktown Elementary School KG-5 | 601 Students | 3.4 miles away | Not Yet Rated | |
| Lee Hall Elementary School PK-5 | 706 Students | 3.4 miles away | Not Yet Rated | |
| Kiln Creek Elementary School PK-5 | 697 Students | 3.7 miles away |  5 out of 5 | |
Compare This School To Nearby Schools ->
School Community Forum

Join a discussion about Richneck Elementary School and talk to others in the community including students, parents, teachers, and administrators.
Popular Discussion Topics
- Admissions and Registration Questions (e.g. Dress Code and Discipline Policy)
- School Calendar and Upcoming Events (e.g. Graduation)
- After School Programs, Extracurricular Activities, and Athletics (e.g. Football)
- News and Announcements (e.g. Yearbook and Class Supply List Details)
- Graduate and Alumni Events (e.g. Organizing Class Reunions)
Navigation
Can't Find What You Are Looking For?
Rankings
Nearby Cities
Sponsored Links
K-12 Articles

School's out for Recess
Recess used to be the best part of school; that and lunch. But today, a shocking two-thirds of...
Recess used to be the best part of school; that and lunch. But today, a shocking two-thirds of...

Teaching Your Kids About Respect, Values and Violence
These days it seems that every newscast reports at least once incident of violence. As parents, we...
These days it seems that every newscast reports at least once incident of violence. As parents, we...

Changing Schools Isn't Easy: Tips for a Successful Transition
It isn't easy for students to make the transition into a new school, especially if they have...
It isn't easy for students to make the transition into a new school, especially if they have...