Ethel M. Gildersleeve Middle School
Rating
Not Available
Not Available

No Reviews Yet
Find Old Friends From Ethel M. Gildersleeve Middle School
Use the form below to search for alumni from Ethel M. Gildersleeve Middle School.
School Description
School Summary and Highlights
- Enrolls 1,054 middle school students from grades 6-8
- Ranks 235th out of 419 middle schools in VA.
School District Details
- Newport News City Public Schools District
- Per-Pupil Spending: $10,032
- Graduation Rate: 66.5%
- Dropout Rate: 3.2%
- Students Per Teacher: 17.9
- Enrolled Students: 30,869
Faculty Details and Student Enrollment
Students and Faculty
- Total Students Enrolled: 1,054
- Total Full Time "Equivalent" Teachers: 49.5
- Average Student-To-Teacher Ratio: 21.3
Students Gender Breakdown
- Males: 523 (49.6%)
- Females: 513 (48.7%)
Free Lunch Student Eligibility Breakdown
- Eligible for Reduced Lunch: 78 (7.4%)
- Eligible for Free Lunch: 284 (26.9%)
- Eligible for Either Reduced or Free Lunch: 362 (34.3%)
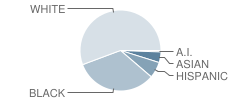
Student Enrollment Distribution by Race / Ethnicity
| Number | Percent | |
|---|---|---|
| American Indian | 6 | 0.6% |
| Black | 342 | 32.4% |
| Asian | 44 | 4.2% |
| Hispanic | 67 | 6.4% |
| White | 577 | 54.7% |
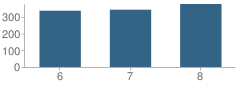
Number of Students Per Grade
| Number | Percent | |
|---|---|---|
| 6th Grade | 336 | 31.9% |
| 7th Grade | 342 | 32.4% |
| 8th Grade | 376 | 35.7% |
Source: VA Department of Education, Source: NCES 2009-2010
School Ratings and Reviews
Be The First To Review Ethel M. Gildersleeve Middle School!
School Map and Similar Schools Nearby
Click to Activate Map of Nearby School Campuses
Private
Public
This School
Similar Schools Nearby
| Homer L. Hines Middle School 6-8 | 909 Students | 2.7 miles away | Not Yet Rated | |
| Crittenden Middle School 6-8 | 832 Students | 4.2 miles away | Not Yet Rated | |
| Tabb Middle School 6-8 | 830 Students | 4.2 miles away |  5 out of 5 | |
| Jefferson Davis Middle School 6-8 | 947 Students | 4.5 miles away | Not Yet Rated | |
| Achievable Dream Middle School 6-11 | 366 Students | 5.9 miles away | Not Yet Rated | |
| Mary Passage Middle School 6-8 | 1,048 Students | 6.2 miles away | Not Yet Rated | |
| Thomas Eaton Middle School 6-8 | 814 Students | 6.3 miles away | Not Yet Rated | |
| C. Alton Lindsay Middle School 6-8 | 764 Students | 6.4 miles away |  2.5 out of 5 | |
| Grafton Middle School 6-8 | 875 Students | 6.5 miles away | Not Yet Rated | |
| B.t. Washington Middle School 6-8 | 441 Students | 7.1 miles away | Not Yet Rated | |
Compare This School To Nearby Schools ->
School Community Forum

Join a discussion about Ethel M. Gildersleeve Middle School and talk to others in the community including students, parents, teachers, and administrators.
Popular Discussion Topics
- Admissions and Registration Questions (e.g. Dress Code and Discipline Policy)
- School Calendar and Upcoming Events (e.g. Graduation)
- After School Programs, Extracurricular Activities, and Athletics (e.g. Football)
- News and Announcements (e.g. Yearbook and Class Supply List Details)
- Graduate and Alumni Events (e.g. Organizing Class Reunions)
Navigation
Can't Find What You Are Looking For?
Rankings
Nearby Cities
Sponsored Links
K-12 Articles

Bullycide: What is It and How Can It Be Prevented?
Disclaimer: This article expresses my opinion that has been formed by personal experience and...
Disclaimer: This article expresses my opinion that has been formed by personal experience and...

Teaching Kids to Deal with Peer Pressure
Parents usually become very concerned when they hear the term "peer pressure." However, peer...
Parents usually become very concerned when they hear the term "peer pressure." However, peer...

Help Your High School Student Create an Impressive Resume
Time has flown. Your teen is in high school and has demonstrated an interest in obtaining a part...
Time has flown. Your teen is in high school and has demonstrated an interest in obtaining a part...