Lafayette-Winona Middle School
Rating
Not Available
Not Available

1 out of 5 | 1 Review
Find Old Friends From Lafayette-Winona Middle School
Use the form below to search for alumni from Lafayette-Winona Middle School.
School Description
School Summary and Highlights
- Enrolls 682 middle school students from grades 6-8
- Ranks 406th out of 419 middle schools in VA.
School District Details
- Norfolk City Public Schools District
- Per-Pupil Spending: $10,290
- Graduation Rate: 53.2%
- Dropout Rate: 5.3%
- Students Per Teacher: 15.7
- Enrolled Students: 34,011
Faculty Details and Student Enrollment
Students and Faculty
- Total Students Enrolled: 682
- Total Full Time "Equivalent" Teachers: 51.2
- Average Student-To-Teacher Ratio: 13.3
Students Gender Breakdown
- Males: 339 (49.7%)
- Females: 320 (46.9%)
Free Lunch Student Eligibility Breakdown
- Eligible for Reduced Lunch: 52 (7.6%)
- Eligible for Free Lunch: 507 (74.3%)
- Eligible for Either Reduced or Free Lunch: 559 (82.0%)
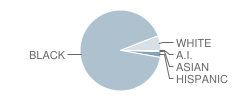
Student Enrollment Distribution by Race / Ethnicity
| Number | Percent | |
|---|---|---|
| American Indian | 2 | 0.3% |
| Black | 602 | 88.3% |
| Asian | 1 | 0.1% |
| Hispanic | 15 | 2.2% |
| White | 39 | 5.7% |
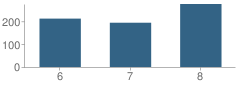
Number of Students Per Grade
| Number | Percent | |
|---|---|---|
| 6th Grade | 212 | 31.1% |
| 7th Grade | 194 | 28.4% |
| 8th Grade | 276 | 40.5% |
Source: VA Department of Education, Source: NCES 2009-2010
School Ratings and Reviews
Overall Rating: 1

1 out of 5 | 1 Review
The Overall Rating is the school's average rating from parents, students, school faculty and staff. The highest rating is five apples and the lowest is one apple.
Share Your Review About This School
1 review for Lafayette-Winona Middle School
- Reviewed by Parent or Guardian on January 31, 2011
- Rating:
 (1 / 5) Flag as inappropriate
 - Lafayette Winona is the worst school there is. The teachers and administrators are ill equiped to educate and discipline the students. I would not recommend anyone send their child to this school if possible.The staff is rude.
School Map and Similar Schools Nearby
Click to Activate Map of Nearby School Campuses
Private
Public
This School
Similar Schools Nearby
| Norview Middle School 6-8 | 925 Students | 1.5 miles away | Not Yet Rated | |
| Ghent Elementary School KG-8 | 585 Students | 1.9 miles away |  5 out of 5 | |
| Rosemont Middle School 7-8 | 347 Students | 2.0 miles away | Not Yet Rated | |
| Blair Middle School 6-8 | 967 Students | 2.1 miles away |  4 out of 5 | |
| Ruffner Middle School 6-8 | 839 Students | 2.6 miles away | Not Yet Rated | |
| School of Intern'l Studies at Meadowbrook 6-8 | 301 Students | 3.1 miles away | Not Yet Rated | |
| Lake Taylor Middle School 6-8 | 793 Students | 3.4 miles away | Not Yet Rated | |
| Azalea Middle School 6-8 | 832 Students | 3.5 miles away | 5 out of 5 | |
| Northside Middle School 6-8 | 866 Students | 3.6 miles away | 5 out of 5 | |
| Park View Elementary School PK-6 | 670 Students | 4.1 miles away | Not Yet Rated | |
Compare This School To Nearby Schools ->
School Community Forum

Join a discussion about Lafayette-Winona Middle School and talk to others in the community including students, parents, teachers, and administrators.
Popular Discussion Topics
- Admissions and Registration Questions (e.g. Dress Code and Discipline Policy)
- School Calendar and Upcoming Events (e.g. Graduation)
- After School Programs, Extracurricular Activities, and Athletics (e.g. Football)
- News and Announcements (e.g. Yearbook and Class Supply List Details)
- Graduate and Alumni Events (e.g. Organizing Class Reunions)
Navigation
Can't Find What You Are Looking For?
Rankings
Sponsored Links
K-12 Articles

Cutting Class
Depression is a very real problem for today's youth. When your spirit doesn't feel good, a lot of...
Depression is a very real problem for today's youth. When your spirit doesn't feel good, a lot of...

Helping Your Child Leave the Nest
It's all come down to this: Eighteen years of good times and bad, and now your baby bird is ready...
It's all come down to this: Eighteen years of good times and bad, and now your baby bird is ready...

Teaching Children Respect
Statistics prove that there are many different family types in today's society. Grandparents or a...
Statistics prove that there are many different family types in today's society. Grandparents or a...