Lee Elementary School
Rating
Not Available
Not Available

5 out of 5 | 1 Review
Find Old Friends From Lee Elementary School
Use the form below to search for alumni from Lee Elementary School.
School Description
School Summary and Highlights
- Enrolls 924 elementary school students from grades KG-5
- Ranks 2095th out of 5,423 elementary schools in CA.
- 2010 Overall School AYP Met Status: No
Additional Contact Information
- Mailing Address: 1620 Temple Ave., Long Beach, CA 90804
School Operational Details
- Title I EligibleAll students of this school are eligible for participation in authorized programs.
School District Details
- Long Beach Unified School District
- Per-Pupil Spending: $9,646
- Graduation Rate: 65.5%
- Dropout Rate: 4.1%
- Students Per Teacher: 22.0
- Enrolled Students: 86,089
Faculty Details and Student Enrollment
Students and Faculty
- Total Students Enrolled: 924
- Total Full Time "Equivalent" Teachers: 47.0
- Average Student-To-Teacher Ratio: 19.7
Students Gender Breakdown
- Males: 469 (50.8%)
- Females: 455 (49.2%)
Free Lunch Student Eligibility Breakdown
- Eligible for Reduced Lunch: 119 (12.9%)
- Eligible for Free Lunch: 756 (81.8%)
- Eligible for Either Reduced or Free Lunch: 875 (94.7%)
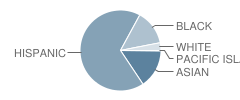
Student Enrollment Distribution by Race / Ethnicity
| Number | Percent | |
|---|---|---|
| American Indian | - | - |
| Black | 127 | 13.7% |
| Asian | 140 | 15.2% |
| Hispanic | 611 | 66.1% |
| White | 28 | 3.0% |
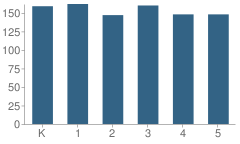
Number of Students Per Grade
| Number | Percent | |
|---|---|---|
| Kindergarten | 159 | 17.2% |
| 1st Grade | 162 | 17.5% |
| 2nd Grade | 147 | 15.9% |
| 3rd Grade | 160 | 17.3% |
| 4th Grade | 148 | 16.0% |
| 5th Grade | 148 | 16.0% |
Teacher Education Background (2009)
Percent With Master's Degree
School:
28.0%
District:
28.5%
Percent With Bachelor's Degree
School:
4.0%
District:
70.4%
Teacher Credentials & Experience (2009)
Percent of Teachers With Credentials: 100.0%
Number of Certificated Staff: 50.0
Average Number of Years of Teacher Experience: 11.8
Average Age
School:
39.1
District:
44.2
Source: CA Department of Education, Source: NCES 2009-2010
School Ratings and Reviews
Overall Rating: 5

5 out of 5 | 1 Review
The Overall Rating is the school's average rating from parents, students, school faculty and staff. The highest rating is five apples and the lowest is one apple.
Share Your Review About This School
1 review for Lee Elementary School
- Reviewed by Parent/Guardian on November 01, 2009
- Rating:
 (5 / 5) Flag as inappropriate
 - what is the grade for my daugther
School Map and Similar Schools Nearby
Click to Activate Map of Nearby School Campuses
Private
Public
This School
Similar Schools Nearby
| Willard Elementary School KG-5 | 690 Students | 0.5 miles away | Not Yet Rated | |
| Whittier Elementary School KG-5 | 867 Students | 0.8 miles away |  2 out of 5 | |
| Bryant Elementary School KG-5 | 355 Students | 0.9 miles away | Not Yet Rated | |
| Mary Butler Elementary School 3-8 | 619 Students | 0.9 miles away | Not Yet Rated | |
| Burbank Elementary School KG-5 | 729 Students | 1.1 miles away | Not Yet Rated | |
| Lincoln Elementary School KG-5 | 1,061 Students | 1.1 miles away | Not Yet Rated | |
| Fremont Elementary School KG-5 | 420 Students | 1.3 miles away | Not Yet Rated | |
| Buffum Elementary School KG-5 | 311 Students | 1.4 miles away | Not Yet Rated | |
| Mann Elementary School KG-5 | 356 Students | 1.5 miles away | Not Yet Rated | |
| Roosevelt Elementary School KG-5 | 1,069 Students | 1.6 miles away |  1 out of 5 | |
Compare This School To Nearby Schools ->
School Community Forum

Join a discussion about Lee Elementary School and talk to others in the community including students, parents, teachers, and administrators.
Popular Discussion Topics
- Admissions and Registration Questions (e.g. Dress Code and Discipline Policy)
- School Calendar and Upcoming Events (e.g. Graduation)
- After School Programs, Extracurricular Activities, and Athletics (e.g. Football)
- News and Announcements (e.g. Yearbook and Class Supply List Details)
- Graduate and Alumni Events (e.g. Organizing Class Reunions)
Navigation
Can't Find What You Are Looking For?
Rankings
Nearby Cities
Sponsored Links
K-12 Articles

What to Do when Your Child Hates School
All kids grumble about going to school at one time or another. This is perfectly normal, but what...
All kids grumble about going to school at one time or another. This is perfectly normal, but what...

School Violence: Can It Be Stopped
It's a fact that violence in schools is prevalent in today's society. We hear of school shootings,...
It's a fact that violence in schools is prevalent in today's society. We hear of school shootings,...

Middle School Homework and Study Habits
The report cards came home and you're disappointed with your child's scores. You know he has the...
The report cards came home and you're disappointed with your child's scores. You know he has the...