Critzer Elementary School
Rating
Not Available
Not Available

5 out of 5 | 1 Review
Find Old Friends From Critzer Elementary School
Use the form below to search for alumni from Critzer Elementary School.
School Description
School Summary and Highlights
- Enrolls 493 preschool and elementary school students from grades PK-5
- Ranks 1090th out of 1,149 elementary schools in VA.
School Operational Details
- Title I EligibleAll students of this school are eligible for participation in authorized programs.
School District Details
- Pulaski County Public Schools District
- Per-Pupil Spending: $8,967
- Graduation Rate: 74.1%
- Dropout Rate: 0.8%
- Students Per Teacher: 14.7
- Enrolled Students: 4,722
Faculty Details and Student Enrollment
Students and Faculty
- Total Students Enrolled: 493
- Total Full Time "Equivalent" Teachers: 32.7
- Average Student-To-Teacher Ratio: 15.1
Students Gender Breakdown
- Males: 215 (43.6%)
- Females: 256 (51.9%)
Free Lunch Student Eligibility Breakdown
- Eligible for Reduced Lunch: 47 (9.5%)
- Eligible for Free Lunch: 278 (56.4%)
- Eligible for Either Reduced or Free Lunch: 325 (65.9%)
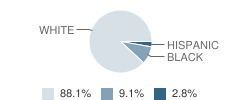
Student Enrollment Distribution by Race / Ethnicity
| Number | Percent | |
|---|---|---|
| American Indian | - | - |
| Black | 43 | 8.7% |
| Asian | - | - |
| Hispanic | 13 | 2.6% |
| White | 415 | 84.2% |
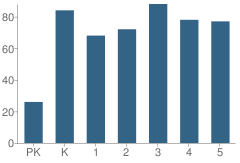
Number of Students Per Grade
| Number | Percent | |
|---|---|---|
| Pre-Kindergarten | 26 | 5.3% |
| Kindergarten | 84 | 17.0% |
| 1st Grade | 68 | 13.8% |
| 2nd Grade | 72 | 14.6% |
| 3rd Grade | 88 | 17.8% |
| 4th Grade | 78 | 15.8% |
| 5th Grade | 77 | 15.6% |
Source: VA Department of Education, Source: NCES 2009-2010
School Ratings and Reviews
Overall Rating: 5

5 out of 5 | 1 Review
The Overall Rating is the school's average rating from parents, students, school faculty and staff. The highest rating is five apples and the lowest is one apple.
Share Your Review About This School
1 review for Critzer Elementary School
- Reviewed by Staff Member on September 09, 2007
- Rating:
 (5 / 5) Flag as inappropriate
 - Great School!
School Map and Similar Schools Nearby
Click to Activate Map of Nearby School Campuses
Private
Public
This School
Similar Schools Nearby
| Pulaski Elementary School PK-5 | 537 Students | 1.4 miles away | Not Yet Rated | |
| Dublin Elementary School PK-5 | 499 Students | 4.7 miles away |  5 out of 5 | |
| Snowville Elementary School PK-5 | 208 Students | 7.2 miles away | Not Yet Rated | |
| Mcharg Elementary School PK-2 | 376 Students | 10.4 miles away | 5 out of 5 | |
| Riverlawn Elementary School PK-5 | 437 Students | 11.3 miles away | 5 out of 5 | |
| Belle Heth Elementary School 3-6 | 487 Students | 11.4 miles away | Not Yet Rated | |
| Max Meadows Elementary School PK-5 | 283 Students | 12.9 miles away |  3 out of 5 | |
| Indian Valley Elementary School PK-7 | 185 Students | 12.9 miles away | Not Yet Rated | |
| Belview Elementary School PK-5 | 265 Students | 13.4 miles away | Not Yet Rated | |
| Jackson Memorial Elementary School PK-5 | 246 Students | 14.7 miles away | Not Yet Rated | |
Compare This School To Nearby Schools ->
School Community Forum

Join a discussion about Critzer Elementary School and talk to others in the community including students, parents, teachers, and administrators.
Popular Discussion Topics
- Admissions and Registration Questions (e.g. Dress Code and Discipline Policy)
- School Calendar and Upcoming Events (e.g. Graduation)
- After School Programs, Extracurricular Activities, and Athletics (e.g. Football)
- News and Announcements (e.g. Yearbook and Class Supply List Details)
- Graduate and Alumni Events (e.g. Organizing Class Reunions)
Navigation
Can't Find What You Are Looking For?
Rankings
Nearby Cities
Sponsored Links
K-12 Articles

Help Your High School Student Create an Impressive Resume
Time has flown. Your teen is in high school and has demonstrated an interest in obtaining a part...
Time has flown. Your teen is in high school and has demonstrated an interest in obtaining a part...

Se Hablan Otras Idiomas?
In the late 1990s, the Salem-Keizer school district in Oregon began requiring every student in its...
In the late 1990s, the Salem-Keizer school district in Oregon began requiring every student in its...

Keep Morning Stress at a Minimum: Establish a Routine
Morning! It can be a time of stress. The kids are fighting over who gets to use the bathroom first,...
Morning! It can be a time of stress. The kids are fighting over who gets to use the bathroom first,...