Stanford Middle School
Rating
Not Available
Not Available

No Reviews Yet
Find Old Friends From Stanford Middle School
Use the form below to search for alumni from Stanford Middle School.
School Description
School Summary and Highlights
- Enrolls 1,314 middle school students from grades 6-8
- Ranks 204th out of 2,050 middle schools in CA.
- 2010 Overall School AYP Met Status: No
Additional Contact Information
- Mailing Address: 5871 East Los Arcos St., Long Beach, CA 90815
School District Details
- Long Beach Unified School District
- Per-Pupil Spending: $9,646
- Graduation Rate: 65.5%
- Dropout Rate: 4.1%
- Students Per Teacher: 22.0
- Enrolled Students: 86,089
Faculty Details and Student Enrollment
Students and Faculty
- Total Students Enrolled: 1,314
- Total Full Time "Equivalent" Teachers: 54.0
- Average Student-To-Teacher Ratio: 24.3
Students Gender Breakdown
- Males: 650 (49.5%)
- Females: 664 (50.5%)
Free Lunch Student Eligibility Breakdown
- Eligible for Reduced Lunch: 123 (9.4%)
- Eligible for Free Lunch: 279 (21.2%)
- Eligible for Either Reduced or Free Lunch: 402 (30.6%)
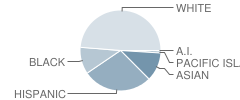
Student Enrollment Distribution by Race / Ethnicity
| Number | Percent | |
|---|---|---|
| American Indian | 5 | 0.4% |
| Black | 141 | 10.7% |
| Asian | 151 | 11.5% |
| Hispanic | 364 | 27.7% |
| White | 633 | 48.2% |
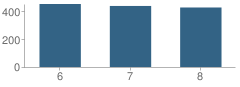
Number of Students Per Grade
| Number | Percent | |
|---|---|---|
| 6th Grade | 451 | 34.3% |
| 7th Grade | 437 | 33.3% |
| 8th Grade | 426 | 32.4% |
Teacher Education Background (2009)
Percent With Ph.D.
School:
3.3%
District:
4.9%
Percent With Master's Degree
School:
18.3%
District:
28.5%
Teacher Credentials & Experience (2009)
Percent of Teachers With Credentials: 100.0%
Number of Certificated Staff: 60.0
Average Number of Years of Teacher Experience: 14.3
Average Age
School:
41.8
District:
44.2
Source: CA Department of Education, Source: NCES 2009-2010
School Ratings and Reviews
Be The First To Review Stanford Middle School!
School Map and Similar Schools Nearby
Click to Activate Map of Nearby School Campuses
Private
Public
This School
Similar Schools Nearby
| Marshall Middle School 6-8 | 837 Students | 1.3 miles away | Not Yet Rated | |
| Tincher Elementary School KG-8 | 1,155 Students | 1.3 miles away |  4.5 out of 5 | |
| Cubberley Elementary School KG-8 | 1,010 Students | 1.4 miles away |  5 out of 5 | |
| Hill Middle School 6-8 | 1,074 Students | 1.5 miles away | 5 out of 5 | |
| Burcham Elementary School KG-8 | 546 Students | 1.6 miles away | Not Yet Rated | |
| Jefferson Leadership Academies School 6-8 | 895 Students | 2.4 miles away | Not Yet Rated | |
| Rogers Middle School 6-8 | 875 Students | 2.4 miles away | 5 out of 5 | |
| Demille Middle School 6-8 | 622 Students | 2.4 miles away | 5 out of 5 | |
| Oak Middle School 6-8 | 994 Students | 2.5 miles away | Not Yet Rated | |
| Newcomb Elementary School KG-8 | 932 Students | 2.6 miles away | 4.5 out of 5 | |
Compare This School To Nearby Schools ->
School Community Forum

Join a discussion about Stanford Middle School and talk to others in the community including students, parents, teachers, and administrators.
Popular Discussion Topics
- Admissions and Registration Questions (e.g. Dress Code and Discipline Policy)
- School Calendar and Upcoming Events (e.g. Graduation)
- After School Programs, Extracurricular Activities, and Athletics (e.g. Football)
- News and Announcements (e.g. Yearbook and Class Supply List Details)
- Graduate and Alumni Events (e.g. Organizing Class Reunions)
Navigation
Can't Find What You Are Looking For?
Rankings
Nearby Cities
Sponsored Links
K-12 Articles

Kids and Competition
In the backyard, the classroom, the community and while participating in sports and other...
In the backyard, the classroom, the community and while participating in sports and other...

Teachers Packing Heat
After the recent school shootings (and thwarted school shootings) in the past month-just as after...
After the recent school shootings (and thwarted school shootings) in the past month-just as after...

The Difference Between Boys and Girls
Boys and girls are different. Give a toddler girl a G.I. Joe and she'll probably try to mother it....
Boys and girls are different. Give a toddler girl a G.I. Joe and she'll probably try to mother it....