Cleveland Elementary School
Rating
Not Available
Not Available

No Reviews Yet
Find Old Friends From Cleveland Elementary School
Use the form below to search for alumni from Cleveland Elementary School.
School Description
School Summary and Highlights
- Enrolls 133 preschool and elementary school students from grades PK-7
- Ranks 96th out of 419 middle schools in VA.
- National Blue Ribbon Schools Award 2010

Additional Contact Information
- Mailing Address: PO Box 70, Cleveland, VA 24225
School Operational Details
- Title I EligibleAll students of this school are eligible for participation in authorized programs.
School District Details
- Russell County Public Schools District
- Per-Pupil Spending: $8,709
- Graduation Rate: 72.8%
- Dropout Rate: 1.9%
- Students Per Teacher: 18.8
- Enrolled Students: 4,314
Faculty Details and Student Enrollment
Students and Faculty
- Total Students Enrolled: 133
- Total Full Time "Equivalent" Teachers: 10.0
- Average Student-To-Teacher Ratio: 13.3
Students Gender Breakdown
- Males: 62 (46.6%)
- Females: 71 (53.4%)
Free Lunch Student Eligibility Breakdown
- Eligible for Reduced Lunch: 7 (5.3%)
- Eligible for Free Lunch: 73 (54.9%)
- Eligible for Either Reduced or Free Lunch: 80 (60.2%)
Student Enrollment Distribution by Race / Ethnicity
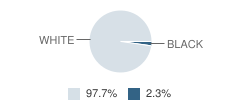
| Number | Percent | |
|---|---|---|
| American Indian | - | - |
| Black | 3 | 2.3% |
| Asian | - | - |
| Hispanic | - | - |
| White | 130 | 97.7% |
Number of Students Per Grade
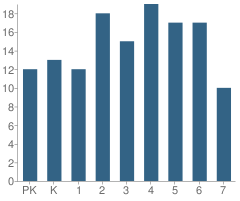
| Number | Percent | |
|---|---|---|
| Pre-Kindergarten | 12 | 9.0% |
| Kindergarten | 13 | 9.8% |
| 1st Grade | 12 | 9.0% |
| 2nd Grade | 18 | 13.5% |
| 3rd Grade | 15 | 11.3% |
| 4th Grade | 19 | 14.3% |
| 5th Grade | 17 | 12.8% |
| 6th Grade | 17 | 12.8% |
| 7th Grade | 10 | 7.5% |
Source: VA Department of Education, Source: NCES 2009-2010
School Ratings and Reviews
Be The First To Review Cleveland Elementary School!
School Map and Similar Schools Nearby
Click to Activate Map of Nearby School Campuses
Private
Public
This School
Similar Schools Nearby
| Castlewood Elementary School 1-7 | 467 Students | 1.9 miles away | Not Yet Rated | |
| Lebanon Elementary School 3-5 | 297 Students | 3.5 miles away | Not Yet Rated | |
| Lebanon Primary School PK-2 | 436 Students | 4.3 miles away | Not Yet Rated | - |
| Belfast Elk Garden Elementary School PK-6 | 177 Students | 7.2 miles away | Not Yet Rated | |
| Council Elementary School PK-7 | 217 Students | 9.4 miles away | Not Yet Rated | |
| Copper Creek Elementary School PK-KG | 124 Students | 10.2 miles away |  5 out of 5 | - |
| Honaker Elementary School PK-7 | 669 Students | 10.6 miles away | Not Yet Rated | |
| St. Paul Elementary School PK-7 | 277 Students | 11.0 miles away | Not Yet Rated | |
| Swords Creek Elementary School 3-7 | 118 Students | 12.3 miles away | Not Yet Rated | |
| Greendale Elementary School PK-5 | 367 Students | 13.9 miles away | Not Yet Rated | |
Compare This School To Nearby Schools ->
School Community Forum

Join a discussion about Cleveland Elementary School and talk to others in the community including students, parents, teachers, and administrators.
Popular Discussion Topics
- Admissions and Registration Questions (e.g. Dress Code and Discipline Policy)
- School Calendar and Upcoming Events (e.g. Graduation)
- After School Programs, Extracurricular Activities, and Athletics (e.g. Football)
- News and Announcements (e.g. Yearbook and Class Supply List Details)
- Graduate and Alumni Events (e.g. Organizing Class Reunions)
Navigation
Can't Find What You Are Looking For?
Rankings
Nearby Cities
Sponsored Links
K-12 Articles

Transform Your Middle School Slacker into a Scholar
All children need motivation to learn. Have your child's grades decreased since he started middle...
All children need motivation to learn. Have your child's grades decreased since he started middle...

Middle School Homework and Study Habits
The report cards came home and you're disappointed with your child's scores. You know he has the...
The report cards came home and you're disappointed with your child's scores. You know he has the...

The Impact on Adopted Children at School
Children who are adopted can be affected both academically and socially at school. Many times...
Children who are adopted can be affected both academically and socially at school. Many times...