Bayside Elementary School
Rating
Not Available
Not Available

No Reviews Yet
Find Old Friends From Bayside Elementary School
Use the form below to search for alumni from Bayside Elementary School.
School Description
School Summary and Highlights
- Enrolls 468 preschool and elementary school students from grades PK-5
- Ranks 455th out of 1,149 elementary schools in VA.
School District Details
- Virginia Beach City Public Schools District
- Per-Pupil Spending: $10,344
- Graduation Rate: 72.7%
- Dropout Rate: 1.7%
- Students Per Teacher: 18.0
- Enrolled Students: 71,182
Faculty Details and Student Enrollment
Students and Faculty
- Total Students Enrolled: 468
- Total Full Time "Equivalent" Teachers: 29.7
- Average Student-To-Teacher Ratio: 15.8
Students Gender Breakdown
- Males: 233 (49.8%)
- Females: 208 (44.4%)
Free Lunch Student Eligibility Breakdown
- Eligible for Reduced Lunch: 57 (12.2%)
- Eligible for Free Lunch: 159 (34.0%)
- Eligible for Either Reduced or Free Lunch: 216 (46.2%)
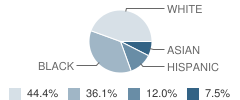
Student Enrollment Distribution by Race / Ethnicity
| Number | Percent | |
|---|---|---|
| American Indian | - | - |
| Black | 159 | 34.0% |
| Asian | 33 | 7.1% |
| Hispanic | 53 | 11.3% |
| White | 196 | 41.9% |
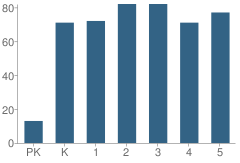
Number of Students Per Grade
| Number | Percent | |
|---|---|---|
| Pre-Kindergarten | 13 | 2.8% |
| Kindergarten | 71 | 15.2% |
| 1st Grade | 72 | 15.4% |
| 2nd Grade | 82 | 17.5% |
| 3rd Grade | 82 | 17.5% |
| 4th Grade | 71 | 15.2% |
| 5th Grade | 77 | 16.5% |
Source: VA Department of Education, Source: NCES 2009-2010
School Ratings and Reviews
Be The First To Review Bayside Elementary School!
School Map and Similar Schools Nearby
Click to Activate Map of Nearby School Campuses
Private
Public
This School
Similar Schools Nearby
| Shelton Park Elementary School PK-5 | 396 Students | 1.8 miles away | Not Yet Rated | |
| Hermitage Elementary School PK-5 | 605 Students | 2.2 miles away |  4.5 out of 5 | |
| Little Creek Elementary School PK-5 | 638 Students | 2.2 miles away | Not Yet Rated | |
| Williams Elementary School 4-5 | 414 Students | 2.4 miles away | Not Yet Rated | |
| Diamond Springs Elementary School PK-1 | 588 Students | 2.5 miles away | Not Yet Rated | - |
| Thoroughgood Elementary School PK-5 | 643 Students | 2.5 miles away | Not Yet Rated | |
| Luxford Elementary School PK-5 | 570 Students | 2.5 miles away |  2 out of 5 | |
| Newtown Road Elementary School 2-3 | 493 Students | 2.5 miles away | Not Yet Rated | |
| Larrymore Elementary School PK-5 | 549 Students | 2.6 miles away |  4 out of 5 | |
| Fairlawn Elementary School PK-5 | 461 Students | 2.7 miles away | Not Yet Rated | |
Compare This School To Nearby Schools ->
School Community Forum

Join a discussion about Bayside Elementary School and talk to others in the community including students, parents, teachers, and administrators.
Popular Discussion Topics
- Admissions and Registration Questions (e.g. Dress Code and Discipline Policy)
- School Calendar and Upcoming Events (e.g. Graduation)
- After School Programs, Extracurricular Activities, and Athletics (e.g. Football)
- News and Announcements (e.g. Yearbook and Class Supply List Details)
- Graduate and Alumni Events (e.g. Organizing Class Reunions)
Navigation
Can't Find What You Are Looking For?
Rankings
Sponsored Links
K-12 Articles

Teacher Tenure: A Double-Edged Sword
Teacher Tenure (the policy making it almost impossible to fire teachers) has noble roots. It was...
Teacher Tenure (the policy making it almost impossible to fire teachers) has noble roots. It was...

Break the Cycle: Teen Dating Violence and Prevention Week
February 5 through 9 was "National Teen Dating Violence Awareness and Prevention Week"....
February 5 through 9 was "National Teen Dating Violence Awareness and Prevention Week"....

The Cervical Cancer Vaccine
All across North America girls between the ages of 11 and 12 have the opportunity to be vaccinated...
All across North America girls between the ages of 11 and 12 have the opportunity to be vaccinated...