Bayside Middle School
Rating
Not Available
Not Available

No Reviews Yet
Find Old Friends From Bayside Middle School
Use the form below to search for alumni from Bayside Middle School.
School Description
School Summary and Highlights
- Enrolls 1,076 middle school students from grades 6-8
- Ranks 369th out of 419 middle schools in VA.
School District Details
- Virginia Beach City Public Schools District
- Per-Pupil Spending: $10,344
- Graduation Rate: 72.7%
- Dropout Rate: 1.7%
- Students Per Teacher: 18.0
- Enrolled Students: 71,182
Faculty Details and Student Enrollment
Students and Faculty
- Total Students Enrolled: 1,076
- Total Full Time "Equivalent" Teachers: 58.6
- Average Student-To-Teacher Ratio: 18.4
Students Gender Breakdown
- Males: 539 (50.1%)
- Females: 492 (45.7%)
Free Lunch Student Eligibility Breakdown
- Eligible for Reduced Lunch: 150 (13.9%)
- Eligible for Free Lunch: 476 (44.2%)
- Eligible for Either Reduced or Free Lunch: 626 (58.2%)
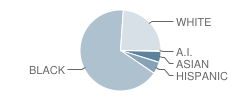
Student Enrollment Distribution by Race / Ethnicity
| Number | Percent | |
|---|---|---|
| American Indian | 4 | 0.4% |
| Black | 687 | 63.8% |
| Asian | 45 | 4.2% |
| Hispanic | 49 | 4.6% |
| White | 246 | 22.9% |
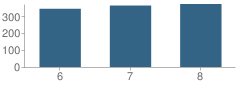
Number of Students Per Grade
| Number | Percent | |
|---|---|---|
| 6th Grade | 343 | 31.9% |
| 7th Grade | 362 | 33.6% |
| 8th Grade | 371 | 34.5% |
Source: VA Department of Education, Source: NCES 2009-2010
School Ratings and Reviews
Be The First To Review Bayside Middle School!
School Map and Similar Schools Nearby
Click to Activate Map of Nearby School Campuses
Private
Public
This School
Similar Schools Nearby
| Kemps Landing Magnet School 6-8 | 600 Students | 1.3 miles away | Not Yet Rated | |
| Independence Middle School 6-8 | 1,270 Students | 2.1 miles away | Not Yet Rated | |
| Lake Taylor Middle School 6-8 | 793 Students | 2.5 miles away | Not Yet Rated | |
| Larkspur Middle School 6-8 | 1,584 Students | 3.8 miles away | Not Yet Rated | |
| Kempsville Middle School 6-8 | 924 Students | 3.8 miles away |  5 out of 5 | |
| Azalea Middle School 6-8 | 832 Students | 4.1 miles away | 5 out of 5 | |
| Norview Middle School 6-8 | 925 Students | 4.9 miles away | Not Yet Rated | |
| Rosemont Middle School 7-8 | 347 Students | 5.0 miles away | Not Yet Rated | |
| Plaza Middle School 6-8 | 1,127 Students | 5.2 miles away |  4.5 out of 5 | |
| Brandon Middle School 6-8 | 1,217 Students | 5.5 miles away | 5 out of 5 | |
Compare This School To Nearby Schools ->
School Community Forum

Join a discussion about Bayside Middle School and talk to others in the community including students, parents, teachers, and administrators.
Popular Discussion Topics
- Admissions and Registration Questions (e.g. Dress Code and Discipline Policy)
- School Calendar and Upcoming Events (e.g. Graduation)
- After School Programs, Extracurricular Activities, and Athletics (e.g. Football)
- News and Announcements (e.g. Yearbook and Class Supply List Details)
- Graduate and Alumni Events (e.g. Organizing Class Reunions)
Navigation
Can't Find What You Are Looking For?
Rankings
Sponsored Links
K-12 Articles

Tips for Easing Your Child's Back to School Stress
Do you remember the roller coaster of emotions that you experienced as a child when the day for...
Do you remember the roller coaster of emotions that you experienced as a child when the day for...

Cell Phones... the Best Thing Since Sliced Bread or the Worst Invention in the World?
Cell phones are wonderful, the best things humans have ever invented! They help us keep in touch...
Cell phones are wonderful, the best things humans have ever invented! They help us keep in touch...

Se Hablan Otras Idiomas?
In the late 1990s, the Salem-Keizer school district in Oregon began requiring every student in its...
In the late 1990s, the Salem-Keizer school district in Oregon began requiring every student in its...