Holland Elementary School
Rating
Not Available
Not Available

3.5 out of 5 | 3 Reviews
Find Old Friends From Holland Elementary School
Use the form below to search for alumni from Holland Elementary School.
School Description
School Summary and Highlights
- Enrolls 584 preschool and elementary school students from grades PK-5
- Ranks 725th out of 1,149 elementary schools in VA.
School Operational Details
- Title I EligibleAll students of this school are eligible for participation in authorized programs.
School District Details
- Virginia Beach City Public Schools District
- Per-Pupil Spending: $10,344
- Graduation Rate: 72.7%
- Dropout Rate: 1.7%
- Students Per Teacher: 18.0
- Enrolled Students: 71,182
Faculty Details and Student Enrollment
Students and Faculty
- Total Students Enrolled: 584
- Total Full Time "Equivalent" Teachers: 41.6
- Average Student-To-Teacher Ratio: 14.0
Students Gender Breakdown
- Males: 289 (49.5%)
- Females: 279 (47.8%)
Free Lunch Student Eligibility Breakdown
- Eligible for Reduced Lunch: 86 (14.7%)
- Eligible for Free Lunch: 299 (51.2%)
- Eligible for Either Reduced or Free Lunch: 385 (65.9%)
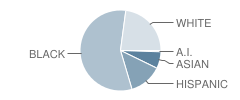
Student Enrollment Distribution by Race / Ethnicity
| Number | Percent | |
|---|---|---|
| American Indian | 3 | 0.5% |
| Black | 322 | 55.1% |
| Asian | 38 | 6.5% |
| Hispanic | 75 | 12.8% |
| White | 130 | 22.3% |
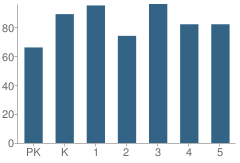
Number of Students Per Grade
| Number | Percent | |
|---|---|---|
| Pre-Kindergarten | 66 | 11.3% |
| Kindergarten | 89 | 15.2% |
| 1st Grade | 95 | 16.3% |
| 2nd Grade | 74 | 12.7% |
| 3rd Grade | 96 | 16.4% |
| 4th Grade | 82 | 14.0% |
| 5th Grade | 82 | 14.0% |
Source: VA Department of Education, Source: NCES 2009-2010
School Ratings and Reviews
Overall Rating: 3.5

3.5 out of 5 | 3 Reviews
The Overall Rating is the school's average rating from parents, students, school faculty and staff. The highest rating is five apples and the lowest is one apple.
Share Your Review About This School
3 reviews for Holland Elementary School
- Reviewed by Parent/Guardian on August 23, 2009
- Rating:
 (4 / 5) Flag as inappropriate
 - I am overall pleased with the education my 2 children have received from Holland. The teachers are eager and friendly and extremely engaged with my girls. The only place I would like to see improvement is in the website. My husband and I work full time and this year my 3 children will be going to 3 different schools and making phone calls each time something is needed or reading stacks of papers sent home can be overwhelming. Websites are an efficient way for me to stay as involved in their individual education goals. For example, I cannot find the school supply list anywhere on the site after being sent a flyer saying that it is there. When I called I was told I have to come in to the office. I'm sorry that I lost her list from 2 months ago, again, it was lost in "the stack" but to have to drive to the school for a list is very inconvenient.
- Reviewed by Parent/Guardian on January 26, 2009
- Rating:
 (2 / 5) Flag as inappropriate
 - We have been at this school for 3 years now. I have one child in 2nd grade and one in Kindergarten. When we started at Holland we didnt have too many complaints. As time has gone on the school has gone down hill. The administration is extremely poor at communicating with parents. Of the office staff there is only one women in the office that is ever willing to help. The others look at you like you are inconveniencing them when you walk in the door. The principal rarely responds to notes or emails sent to him. The cafeteria manager is rude to parents, students and volunteers alike. We were told by our realtor when we bought in this area that this was an excellent school. We found out too late that it is adiquit but far from excellent. And the trouble makers run wild with very little consequence. Students being assulted in the bathrooms and on the buses. Not at all what we had hoped for.
- Reviewed by Parent/Guardian on January 18, 2009
- Rating:
 (5 / 5) Flag as inappropriate
 - this is our first year here. i have been more than pleased with the staff and the kids here. my daughter is leraning disabled adn she has done remarkable here.
School Map and Similar Schools Nearby
Click to Activate Map of Nearby School Campuses
Private
Public
This School
Similar Schools Nearby
| Green Run Elementary School PK-5 | 494 Students | 0.4 miles away |  5 out of 5 | |
| Rosemont Elementary School PK-5 | 346 Students | 0.9 miles away | Not Yet Rated | |
| Brookwood Elementary School PK-5 | 697 Students | 1.2 miles away | Not Yet Rated | |
| Windsor Oaks Elementary School PK-5 | 624 Students | 1.5 miles away | Not Yet Rated | |
| White Oaks Elementary School PK-5 | 795 Students | 1.9 miles away | Not Yet Rated | |
| Parkway Elementary School PK-5 | 483 Students | 2.0 miles away | Not Yet Rated | |
| Windsor Woods Elementary School PK-5 | 462 Students | 2.1 miles away | Not Yet Rated | |
| Lynnhaven Elementary School PK-5 | 512 Students | 2.1 miles away | Not Yet Rated | |
| Landstown Elementary School PK-5 | 778 Students | 2.2 miles away | Not Yet Rated | |
| Rosemont Forest Elementary School PK-5 | 524 Students | 2.7 miles away | 5 out of 5 | |
Compare This School To Nearby Schools ->
School Community Forum

Join a discussion about Holland Elementary School and talk to others in the community including students, parents, teachers, and administrators.
Popular Discussion Topics
- Admissions and Registration Questions (e.g. Dress Code and Discipline Policy)
- School Calendar and Upcoming Events (e.g. Graduation)
- After School Programs, Extracurricular Activities, and Athletics (e.g. Football)
- News and Announcements (e.g. Yearbook and Class Supply List Details)
- Graduate and Alumni Events (e.g. Organizing Class Reunions)
Navigation
Can't Find What You Are Looking For?
Rankings
Nearby Cities
Sponsored Links
K-12 Articles

Idle Hands
The worst affliction affecting our kids today is not teen pregnancy, drugs and alcohol, or...
The worst affliction affecting our kids today is not teen pregnancy, drugs and alcohol, or...

Bullycide: What is It and How Can It Be Prevented?
Disclaimer: This article expresses my opinion that has been formed by personal experience and...
Disclaimer: This article expresses my opinion that has been formed by personal experience and...

Teaching Your Kids About Respect, Values and Violence
These days it seems that every newscast reports at least once incident of violence. As parents, we...
These days it seems that every newscast reports at least once incident of violence. As parents, we...