Independence Middle School
Rating
Not Available
Not Available

No Reviews Yet
Find Old Friends From Independence Middle School
Use the form below to search for alumni from Independence Middle School.
School Description
School Summary and Highlights
- Enrolls 1,270 middle school students from grades 6-8
- Ranks 217th out of 419 middle schools in VA.
School District Details
- Virginia Beach City Public Schools District
- Per-Pupil Spending: $10,344
- Graduation Rate: 72.7%
- Dropout Rate: 1.7%
- Students Per Teacher: 18.0
- Enrolled Students: 71,182
Faculty Details and Student Enrollment
Students and Faculty
- Total Students Enrolled: 1,270
- Total Full Time "Equivalent" Teachers: 64.9
- Average Student-To-Teacher Ratio: 19.6
Students Gender Breakdown
- Males: 658 (51.8%)
- Females: 565 (44.5%)
Free Lunch Student Eligibility Breakdown
- Eligible for Reduced Lunch: 133 (10.5%)
- Eligible for Free Lunch: 273 (21.5%)
- Eligible for Either Reduced or Free Lunch: 406 (32.0%)
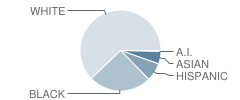
Student Enrollment Distribution by Race / Ethnicity
| Number | Percent | |
|---|---|---|
| American Indian | 5 | 0.4% |
| Black | 308 | 24.3% |
| Asian | 61 | 4.8% |
| Hispanic | 89 | 7.0% |
| White | 760 | 59.8% |
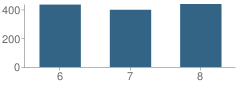
Number of Students Per Grade
| Number | Percent | |
|---|---|---|
| 6th Grade | 434 | 34.2% |
| 7th Grade | 398 | 31.3% |
| 8th Grade | 438 | 34.5% |
Source: VA Department of Education, Source: NCES 2009-2010
School Ratings and Reviews
Be The First To Review Independence Middle School!
School Map and Similar Schools Nearby
Click to Activate Map of Nearby School Campuses
Private
Public
This School
Similar Schools Nearby
| Kemps Landing Magnet School 6-8 | 600 Students | 1.8 miles away | Not Yet Rated | |
| Bayside Middle School 6-8 | 1,076 Students | 2.1 miles away | Not Yet Rated | |
| Great Neck Middle School 6-8 | 1,060 Students | 3.9 miles away | Not Yet Rated | |
| Lake Taylor Middle School 6-8 | 793 Students | 4.4 miles away | Not Yet Rated | |
| Plaza Middle School 6-8 | 1,127 Students | 4.4 miles away |  4.5 out of 5 | |
| Larkspur Middle School 6-8 | 1,584 Students | 4.6 miles away | Not Yet Rated | |
| Kempsville Middle School 6-8 | 924 Students | 5.0 miles away |  5 out of 5 | |
| Azalea Middle School 6-8 | 832 Students | 5.1 miles away | 5 out of 5 | |
| Lynnhaven Middle School 6-8 | 1,201 Students | 5.1 miles away | 5 out of 5 | |
| Rosemont Middle School 7-8 | 347 Students | 6.3 miles away | Not Yet Rated | |
Compare This School To Nearby Schools ->
School Community Forum

Join a discussion about Independence Middle School and talk to others in the community including students, parents, teachers, and administrators.
Popular Discussion Topics
- Admissions and Registration Questions (e.g. Dress Code and Discipline Policy)
- School Calendar and Upcoming Events (e.g. Graduation)
- After School Programs, Extracurricular Activities, and Athletics (e.g. Football)
- News and Announcements (e.g. Yearbook and Class Supply List Details)
- Graduate and Alumni Events (e.g. Organizing Class Reunions)
Navigation
Can't Find What You Are Looking For?
Rankings
Nearby Cities
Sponsored Links
K-12 Articles

Making Sense of No Child Left Behind
The No Child Left Behind Act of 2001 has met with mixed results and mixed feelings. Some think it...
The No Child Left Behind Act of 2001 has met with mixed results and mixed feelings. Some think it...

Idle Hands
The worst affliction affecting our kids today is not teen pregnancy, drugs and alcohol, or...
The worst affliction affecting our kids today is not teen pregnancy, drugs and alcohol, or...

Teaching Children a Love of History
Parents and grandparents are responsible for teaching children a love of history. To begin, relate...
Parents and grandparents are responsible for teaching children a love of history. To begin, relate...