Kempsville High School
Rating
Not Available
Not Available

5 out of 5 | 1 Review
Find Old Friends From Kempsville High School
Use the form below to search for alumni from Kempsville High School.
School Description
School Summary and Highlights
- Enrolls 1,839 high school students from grades 9-12
- Ranks 188th out of 313 high schools in VA.
School District Details
- Virginia Beach City Public Schools District
- Per-Pupil Spending: $10,344
- Graduation Rate: 72.7%
- Dropout Rate: 1.7%
- Students Per Teacher: 18.0
- Enrolled Students: 71,182
Faculty Details and Student Enrollment
Students and Faculty
- Total Students Enrolled: 1,839
- Total Full Time "Equivalent" Teachers: 91.4
- Average Student-To-Teacher Ratio: 20.1
Students Gender Breakdown
- Males: 934 (50.8%)
- Females: 844 (45.9%)
Free Lunch Student Eligibility Breakdown
- Eligible for Reduced Lunch: 129 (7.0%)
- Eligible for Free Lunch: 206 (11.2%)
- Eligible for Either Reduced or Free Lunch: 335 (18.2%)
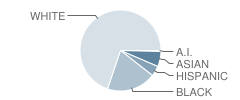
Student Enrollment Distribution by Race / Ethnicity
| Number | Percent | |
|---|---|---|
| American Indian | 7 | 0.4% |
| Black | 349 | 19.0% |
| Asian | 108 | 5.9% |
| Hispanic | 73 | 4.0% |
| White | 1,241 | 67.5% |
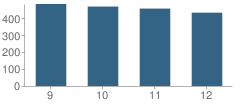
Number of Students Per Grade
| Number | Percent | |
|---|---|---|
| 9th Grade | 483 | 26.3% |
| 10th Grade | 468 | 25.4% |
| 11th Grade | 456 | 24.8% |
| 12th Grade | 432 | 23.5% |
Source: VA Department of Education, Source: NCES 2009-2010
School Ratings and Reviews
Overall Rating: 5

5 out of 5 | 1 Review
The Overall Rating is the school's average rating from parents, students, school faculty and staff. The highest rating is five apples and the lowest is one apple.
Share Your Review About This School
1 review for Kempsville High School
- Reviewed by Former Student on May 01, 2007
- Rating:
 (5 / 5) Flag as inappropriate
 - THE TEACHERS ARE EXTREMELY FULL OF LIFE AND THIS SHOWS IN THE WAY THEY TEACH. I LOVED BEING A STUDENT,I WOULD LOVE TO TAKE THE TIME TO SAY THANKS TO ALL THE STAFF, THANKS FOR MAKING A DIFFERENCE IN MY LIFE. I HAVE NO REGRETS
I LOVE AND WOULD RECOMMEND THIS SCHOOL
TO ANYONE.
LOVE MISS JAMAICA
ADM CLASS OF 1998
KEEP UP THE GOOD WORK ONE CHILD LIFE IS
WORTH RUNNING THE EXTRA MILE.
School Map and Similar Schools Nearby
Click to Activate Map of Nearby School Campuses
Private
Public
This School
Similar Schools Nearby
| Princess Anne High School 9-12 | 1,901 Students | 2.5 miles away | Not Yet Rated | |
| Green Run High School 9-12 | 1,830 Students | 2.7 miles away | Not Yet Rated | |
| Tallwood High School 9-12 | 2,172 Students | 2.8 miles away | Not Yet Rated | |
| Bayside High School 9-12 | 1,995 Students | 3.5 miles away |  4 out of 5 | |
| Landstown High School 9-12 | 2,493 Students | 4.1 miles away | Not Yet Rated | |
| Lake Taylor High School 9-12 | 1,445 Students | 4.3 miles away | Not Yet Rated | |
| Indian River High School 9-12 | 1,706 Students | 4.9 miles away |  5 out of 5 | |
| B. T. Washington High School 9-12 | 1,470 Students | 6.4 miles away | Not Yet Rated | |
| Floyd Kellam High School 9-12 | 1,859 Students | 7.1 miles away | Not Yet Rated | |
| Norview High School 9-12 | 1,956 Students | 7.1 miles away | 5 out of 5 | |
Compare This School To Nearby Schools ->
School Community Forum

Join a discussion about Kempsville High School and talk to others in the community including students, parents, teachers, and administrators.
Popular Discussion Topics
- Admissions and Registration Questions (e.g. Dress Code and Discipline Policy)
- School Calendar and Upcoming Events (e.g. Graduation)
- After School Programs, Extracurricular Activities, and Athletics (e.g. Football)
- News and Announcements (e.g. Yearbook and Class Supply List Details)
- Graduate and Alumni Events (e.g. Organizing Class Reunions)
Navigation
Can't Find What You Are Looking For?
Rankings
Sponsored Links
K-12 Articles

Changing Schools Isn't Easy: Tips for a Successful Transition
It isn't easy for students to make the transition into a new school, especially if they have...
It isn't easy for students to make the transition into a new school, especially if they have...

Siblings and Individual Identity in High School
When the first day of high school looms in the near future, teens are both excited and anxious....
When the first day of high school looms in the near future, teens are both excited and anxious....

Teaching Kids to Deal with Peer Pressure
Parents usually become very concerned when they hear the term "peer pressure." However, peer...
Parents usually become very concerned when they hear the term "peer pressure." However, peer...