Thoroughgood Elementary School
Rating
Not Available
Not Available

No Reviews Yet
Find Old Friends From Thoroughgood Elementary School
Use the form below to search for alumni from Thoroughgood Elementary School.
School Description
School Summary and Highlights
- Enrolls 643 preschool and elementary school students from grades PK-5
- Ranks 90th out of 1,149 elementary schools in VA.
School District Details
- Virginia Beach City Public Schools District
- Per-Pupil Spending: $10,344
- Graduation Rate: 72.7%
- Dropout Rate: 1.7%
- Students Per Teacher: 18.0
- Enrolled Students: 71,182
Faculty Details and Student Enrollment
Students and Faculty
- Total Students Enrolled: 643
- Total Full Time "Equivalent" Teachers: 31.8
- Average Student-To-Teacher Ratio: 20.2
Students Gender Breakdown
- Males: 328 (51.0%)
- Females: 283 (44.0%)
Free Lunch Student Eligibility Breakdown
- Eligible for Reduced Lunch: 34 (5.3%)
- Eligible for Free Lunch: 74 (11.5%)
- Eligible for Either Reduced or Free Lunch: 108 (16.8%)
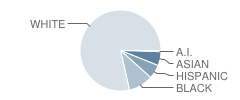
Student Enrollment Distribution by Race / Ethnicity
| Number | Percent | |
|---|---|---|
| American Indian | 3 | 0.5% |
| Black | 60 | 9.3% |
| Asian | 34 | 5.3% |
| Hispanic | 34 | 5.3% |
| White | 480 | 74.7% |
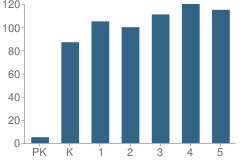
Number of Students Per Grade
| Number | Percent | |
|---|---|---|
| Pre-Kindergarten | 5 | 0.8% |
| Kindergarten | 87 | 13.5% |
| 1st Grade | 105 | 16.3% |
| 2nd Grade | 100 | 15.6% |
| 3rd Grade | 111 | 17.3% |
| 4th Grade | 120 | 18.7% |
| 5th Grade | 115 | 17.9% |
Source: VA Department of Education, Source: NCES 2009-2010
School Ratings and Reviews
Be The First To Review Thoroughgood Elementary School!
School Map and Similar Schools Nearby
Click to Activate Map of Nearby School Campuses
Private
Public
This School
Similar Schools Nearby
| Hermitage Elementary School PK-5 | 605 Students | 0.6 miles away |  4.5 out of 5 | |
| Shelton Park Elementary School PK-5 | 396 Students | 0.9 miles away | Not Yet Rated | |
| Luxford Elementary School PK-5 | 570 Students | 1.3 miles away |  2 out of 5 | |
| Old Donation Center School 2-5 | 507 Students | 1.3 miles away |  5 out of 5 | |
| Pembroke Meadows Elementary School PK-5 | 465 Students | 1.7 miles away | 5 out of 5 | |
| Diamond Springs Elementary School PK-1 | 588 Students | 2.1 miles away | Not Yet Rated | - |
| Pembroke Elementary School PK-5 | 568 Students | 2.2 miles away | Not Yet Rated | |
| Newtown Road Elementary School 2-3 | 493 Students | 2.3 miles away | Not Yet Rated | |
| Williams Elementary School 4-5 | 414 Students | 2.4 miles away | Not Yet Rated | |
| Bayside Elementary School PK-5 | 468 Students | 2.5 miles away | Not Yet Rated | |
Compare This School To Nearby Schools ->
School Community Forum

Join a discussion about Thoroughgood Elementary School and talk to others in the community including students, parents, teachers, and administrators.
Popular Discussion Topics
- Admissions and Registration Questions (e.g. Dress Code and Discipline Policy)
- School Calendar and Upcoming Events (e.g. Graduation)
- After School Programs, Extracurricular Activities, and Athletics (e.g. Football)
- News and Announcements (e.g. Yearbook and Class Supply List Details)
- Graduate and Alumni Events (e.g. Organizing Class Reunions)
Navigation
Can't Find What You Are Looking For?
Rankings
Nearby Cities
Sponsored Links
K-12 Articles

Idle Hands
The worst affliction affecting our kids today is not teen pregnancy, drugs and alcohol, or...
The worst affliction affecting our kids today is not teen pregnancy, drugs and alcohol, or...

Breakfast, Kids and Learning
For generations parents have been telling their kids that breakfast is the most important meal of...
For generations parents have been telling their kids that breakfast is the most important meal of...

The Most Used Form of Communication
Writing has, quite surprisingly, become more and more important in today's electronic society....
Writing has, quite surprisingly, become more and more important in today's electronic society....