Los Alamitos High School

No Reviews Yet
Find Old Friends From Los Alamitos High School
Use the form below to search for alumni from Los Alamitos High School.
School Description
School Summary and Highlights
- Enrolls 3,282 high school students from grades 9-12
- Ranks 27th out of 1,197 high schools in CA.
- 2010 Overall School AYP Met Status: Yes
Additional Contact Information
- Mailing Address: 3591 Cerritos Ave., Los Alamitos, CA 90720
School District Details
- Los Alamitos Unified School District
- Per-Pupil Spending: $7,959
- Graduation Rate: 94.6%
- Dropout Rate: 0.6%
- Students Per Teacher: 26.8
- Enrolled Students: 9,570
Faculty Details and Student Enrollment
Students and Faculty
- Total Students Enrolled: 3,282
- Total Full Time "Equivalent" Teachers: 110.6
- Average Student-To-Teacher Ratio: 29.7
Students Gender Breakdown
- Males: 1,619 (49.3%)
- Females: 1,663 (50.7%)
Free Lunch Student Eligibility Breakdown
- Eligible for Reduced Lunch: 65 (2.0%)
- Eligible for Free Lunch: 135 (4.1%)
- Eligible for Either Reduced or Free Lunch: 200 (6.1%)
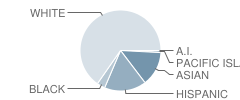
Student Enrollment Distribution by Race / Ethnicity

| Number | Percent | |
|---|---|---|
| American Indian | 10 | 0.3% |
| Black | 108 | 3.3% |
| Asian | 445 | 13.6% |
| Hispanic | 539 | 16.4% |
| White | 2,093 | 63.8% |
Number of Students Per Grade

| Number | Percent | |
|---|---|---|
| 9th Grade | 880 | 26.8% |
| 10th Grade | 831 | 25.3% |
| 11th Grade | 820 | 25.0% |
| 12th Grade | 751 | 22.9% |
Graduates Information (2010)
Graduation Rate
School:
98.9%
District:
97.4%
State:
78.6%
Teacher Education Background (2009)
Percent With Ph.D.
School:
2.9%
District:
15.4%
Percent With Master's Degree
School:
9.4%
District:
7.7%
Percent With Bachelor's Degree
School:
2.2%
District:
38.5%
Teacher Credentials & Experience (2009)
Percent of Teachers With Credentials: 99.2%
Number of Certificated Staff: 139.0
Average Number of Years of Teacher Experience: 14.4
Average Age
School:
41.1
District:
45.7
Source: CA Department of Education, Source: NCES 2009-2010
School Ratings and Reviews
Be The First To Review Los Alamitos High School!
Sponsored Links
Test Scores and Performance Information
Overall School Rating
How is this determined?
The overall school rating shows that Los Alamitos High School performed on average much better than most other schools across the state on CST state exams in the following subjects:
- CST Algebra I
- CST Algebra II
- CST Biology
- CST Chemistry
- CST Earth Science
- CST English-Language Arts
- CST General Mathematics
- CST Geometry
- CST Physics
- CST Science
- CST Summative High School Math
- CST U.S. History
- CST World History
AYP Results (2010)
Overall AYP Met: Yes
ELA AYP Met: Yes
Math AYP Met: Yes
ACT Exam Results (2009)
Percent of Students Taking ACT Exam: 28.1%
Average Combined Score: 25.5
Percent Scoring At or Above 21: 84.8%
SAT Exam Results (2009)
Percent of Students Taking SAT Exam: 64.8%
Average Combined Score: 1,652.3
Critical Reading Average: 545.7
Math Average: 563.9
Writing Average: 542.8
Percent Scoring At or Above 1500: 71.2%
CST - Test Proficiency by Grade and Subject
Grade 9 - % of students at or above proficiency
| School | District | State | |
|---|---|---|---|
| CST Algebra I Test | |||
| 2010 | 74.0% | 74.0% | 22.0% |
| 2009 | 81.0% | 81.0% | 21.0% |
| 2008 | 69.0% | 69.0% | 18.0% |
| CST Algebra II Test | |||
| 2010 | 82.0% | 82.0% | 69.0% |
| CST Biology Test | |||
| 2010 | 75.0% | 75.0% | 55.0% |
| 2009 | 76.0% | 76.0% | 51.0% |
| 2008 | 75.0% | 75.0% | 52.0% |
| CST Chemistry Test | |||
| 2010 | 98.0% | 98.0% | 49.0% |
| 2009 | 98.0% | 98.0% | 44.0% |
| 2008 | 100.0% | 100.0% | 44.0% |
| CST Earth Science Test | |||
| 2010 | 43.0% | 43.0% | 35.0% |
| 2009 | 32.0% | 32.0% | 29.0% |
| 2008 | 41.0% | 41.0% | 31.0% |
| CST English-Language Arts Test | |||
| 2010 | 88.0% | 88.0% | 54.0% |
| 2009 | 86.0% | 86.0% | 50.0% |
| 2008 | 84.0% | 84.0% | 49.0% |
| CST General Mathematics Test | |||
| 2010 | 38.0% | 38.0% | 17.0% |
| 2009 | 49.0% | 49.0% | 17.0% |
| 2008 | 66.0% | 65.0% | 18.0% |
| CST Geometry Test | |||
| 2010 | 87.0% | 87.0% | 46.0% |
| 2009 | 96.0% | 96.0% | 47.0% |
| 2008 | 81.0% | 81.0% | 43.0% |
Grade 10 - % of students at or above proficiency
| School | District | State | |
|---|---|---|---|
| CST Algebra I Test | |||
| 2010 | 28.0% | 27.0% | 12.0% |
| 2009 | 29.0% | 28.0% | 11.0% |
| 2008 | 17.0% | 16.0% | 9.0% |
| CST Algebra II Test | |||
| 2010 | 84.0% | 84.0% | 40.0% |
| 2009 | 80.0% | 80.0% | 37.0% |
| 2008 | 83.0% | 83.0% | 36.0% |
| CST Biology Test | |||
| 2010 | 65.0% | 65.0% | 38.0% |
| 2009 | 53.0% | 52.0% | 34.0% |
| 2008 | 53.0% | 53.0% | 35.0% |
| CST Chemistry Test | |||
| 2010 | 84.0% | 84.0% | 47.0% |
| 2009 | 73.0% | 73.0% | 44.0% |
| 2008 | 72.0% | 72.0% | 41.0% |
| CST Earth Science Test | |||
| 2010 | 35.0% | 35.0% | 29.0% |
| 2009 | 25.0% | 27.0% | 23.0% |
| 2008 | 26.0% | 26.0% | 23.0% |
| CST English-Language Arts Test | |||
| 2010 | 76.0% | 75.0% | 45.0% |
| 2009 | 72.0% | 72.0% | 44.0% |
| 2008 | 64.0% | 62.0% | 41.0% |
| CST Geometry Test | |||
| 2010 | 43.0% | 43.0% | 14.0% |
| 2009 | 39.0% | 39.0% | 14.0% |
| 2008 | 33.0% | 33.0% | 12.0% |
| CST Science Test | |||
| 2010 | 79.0% | 79.0% | 46.0% |
| 2009 | 74.0% | 73.0% | 44.0% |
| 2008 | 63.0% | 63.0% | 40.0% |
| CST World History Test | |||
| 2010 | 78.0% | 78.0% | 42.0% |
| 2009 | 71.0% | 71.0% | 38.0% |
| 2008 | 61.0% | 60.0% | 33.0% |
| CST Summative High School Math Test | |||
| 2008 | 83.0% | 83.0% | 68.0% |
Grade 11 - % of students at or above proficiency
| School | District | State | |
|---|---|---|---|
| CST Algebra I Test | |||
| 2010 | 32.0% | 32.0% | 8.0% |
| 2009 | 29.0% | 23.0% | 8.0% |
| 2008 | 16.0% | 16.0% | 5.0% |
| CST Algebra II Test | |||
| 2010 | 52.0% | 52.0% | 14.0% |
| 2009 | 51.0% | 51.0% | 12.0% |
| 2008 | 55.0% | 56.0% | 11.0% |
| CST Biology Test | |||
| 2010 | 79.0% | 76.0% | 46.0% |
| 2009 | 73.0% | 71.0% | 41.0% |
| 2008 | 68.0% | 68.0% | 39.0% |
| CST Chemistry Test | |||
| 2010 | 65.0% | 65.0% | 30.0% |
| 2009 | 58.0% | 58.0% | 27.0% |
| 2008 | 56.0% | 56.0% | 25.0% |
| CST Earth Science Test | |||
| 2010 | 36.0% | 39.0% | 32.0% |
| 2009 | 33.0% | 35.0% | 26.0% |
| 2008 | 20.0% | 12.0% | 28.0% |
| CST English-Language Arts Test | |||
| 2010 | 75.0% | 73.0% | 42.0% |
| 2009 | 67.0% | 65.0% | 40.0% |
| 2008 | 60.0% | 57.0% | 37.0% |
| CST Geometry Test | |||
| 2010 | 17.0% | 17.0% | 6.0% |
| 2009 | 14.0% | 14.0% | 7.0% |
| 2008 | 9.0% | 9.0% | 6.0% |
| CST Physics Test | |||
| 2010 | 87.0% | 87.0% | 53.0% |
| 2009 | 77.0% | 77.0% | 50.0% |
| 2008 | 79.0% | 79.0% | 47.0% |
| CST Summative High School Math Test | |||
| 2010 | 80.0% | 80.0% | 50.0% |
| 2009 | 66.0% | 66.0% | 47.0% |
| 2008 | 78.0% | 78.0% | 43.0% |
| CST U.S. History Test | |||
| 2010 | 79.0% | 78.0% | 45.0% |
| 2009 | 78.0% | 76.0% | 44.0% |
| 2008 | 71.0% | 67.0% | 38.0% |
End of Course - % of students at or above proficiency
| School | District | State | |
|---|---|---|---|
| CST Algebra I Test | |||
| 2010 | 59.0% | 73.0% | 31.0% |
| 2009 | 64.0% | 72.0% | 28.0% |
| 2008 | 49.0% | 62.0% | 25.0% |
| CST Algebra II Test | |||
| 2010 | 66.0% | 66.0% | 31.0% |
| 2009 | 65.0% | 65.0% | 28.0% |
| 2008 | 66.0% | 67.0% | 27.0% |
| CST Biology Test | |||
| 2010 | 74.0% | 74.0% | 46.0% |
| 2009 | 72.0% | 71.0% | 42.0% |
| 2008 | 70.0% | 70.0% | 42.0% |
| CST Chemistry Test | |||
| 2010 | 78.0% | 78.0% | 38.0% |
| 2009 | 69.0% | 69.0% | 36.0% |
| 2008 | 65.0% | 65.0% | 32.0% |
| CST Earth Science Test | |||
| 2010 | 39.0% | 40.0% | 33.0% |
| 2009 | 30.0% | 32.0% | 28.0% |
| 2008 | 35.0% | 31.0% | 28.0% |
| CST General Mathematics Test | |||
| 2010 | 38.0% | 56.0% | 27.0% |
| 2009 | 49.0% | 54.0% | 26.0% |
| 2008 | 66.0% | 66.0% | 27.0% |
| CST Geometry Test | |||
| 2010 | 56.0% | 56.0% | 27.0% |
| 2009 | 54.0% | 54.0% | 26.0% |
| 2008 | 47.0% | 47.0% | 24.0% |
| CST Physics Test | |||
| 2010 | 88.0% | 88.0% | 49.0% |
| 2009 | 76.0% | 76.0% | 46.0% |
| 2008 | 78.0% | 78.0% | 43.0% |
| CST Summative High School Math Test | |||
| 2010 | 80.0% | 80.0% | 54.0% |
| 2009 | 66.0% | 66.0% | 50.0% |
| 2008 | 78.0% | 78.0% | 47.0% |
| CST World History Test | |||
| 2010 | 78.0% | 78.0% | 41.0% |
| 2009 | 71.0% | 70.0% | 38.0% |
| 2008 | 60.0% | 58.0% | 33.0% |
Source: CA Department of Education 2009-2010
School Map and Similar Schools Nearby
Click to Activate Map of Nearby School Campuses
Private
Public
This School
Similar Schools Nearby
| Lexington Junior High School 7-8 | 1,215 Students | 1.0 miles away | ![]() 5 out of 5 | |
| Oxford High School 7-12 | 1,135 Students | 1.6 miles away | Not Yet Rated | |
| Artesia High School 9-12 | 1,688 Students | 2.3 miles away | ![]() 5 out of 5 | |
| Cypress High School 9-12 | 2,422 Students | 2.4 miles away | Not Yet Rated | |
| Millikan High School 9-12 | 4,291 Students | 2.5 miles away | Not Yet Rated | |
| John F. Kennedy High School 9-12 | 2,401 Students | 2.6 miles away | Not Yet Rated | |
| Walker Junior High School 7-8 | 1,199 Students | 2.8 miles away | Not Yet Rated | |
| Lakewood High School 9-12 | 4,218 Students | 3.6 miles away | ![]() 5 out of 5 | |
| Cerritos High School 9-12 | 2,134 Students | 3.6 miles away | ![]() 4 out of 5 | |
| Mayfair High School 7-12 | 3,579 Students | 4.3 miles away | Not Yet Rated | |
Compare This School To Nearby Schools ->
School Community Forum

Join a discussion about Los Alamitos High School and talk to others in the community including students, parents, teachers, and administrators.
Popular Discussion Topics
- Admissions and Registration Questions (e.g. Dress Code and Discipline Policy)
- School Calendar and Upcoming Events (e.g. Graduation)
- After School Programs, Extracurricular Activities, and Athletics (e.g. Football)
- News and Announcements (e.g. Yearbook and Class Supply List Details)
- Graduate and Alumni Events (e.g. Organizing Class Reunions)
Navigation
Can't Find What You Are Looking For?
Rankings
Nearby Cities
Sponsored Links
K-12 Articles
Tips for Easing Your Child's Back to School Stress
Do you remember the roller coaster of emotions that you experienced as a child when the day for...
Homework Tips: Taking the Work out of Homework
Kids hate homework. It seems that almost every night of the week they are overloaded with...
Special Needs Education: Your Child, Your Rights
Many children today have special needs that make it difficult for them to learn. It's imperative...


