Belvedere Middle School
Rating
Not Available
Not Available

No Reviews Yet
Find Old Friends From Belvedere Middle School
Use the form below to search for alumni from Belvedere Middle School.
School Description
School Summary and Highlights
- Enrolls 1,906 middle school students from grades 6-8
- Ranks 1865th out of 2,050 middle schools in CA.
- 2010 Overall School AYP Met Status: No
Additional Contact Information
- Mailing Address: 312 North Record Ave., Los Angeles, CA 90063
School Operational Details
- Title I EligibleAll students of this school are eligible for participation in authorized programs.
School District Details
- Los Angeles Unified School District
- Per-Pupil Spending: $11,357
- Graduation Rate: 48.8%
- Dropout Rate: 6.8%
- Students Per Teacher: 21.3
- Enrolled Students: 667,870
Faculty Details and Student Enrollment
Students and Faculty
- Total Students Enrolled: 1,906
- Total Full Time "Equivalent" Teachers: 98.7
- Average Student-To-Teacher Ratio: 19.3
Students Gender Breakdown
- Males: 970 (50.9%)
- Females: 936 (49.1%)
Free Lunch Student Eligibility Breakdown
- Eligible for Reduced Lunch: 55 (2.9%)
- Eligible for Free Lunch: 1,706 (89.5%)
- Eligible for Either Reduced or Free Lunch: 1,761 (92.4%)
Student Enrollment Distribution by Race / Ethnicity
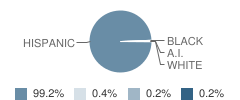
| Number | Percent | |
|---|---|---|
| American Indian | 3 | 0.2% |
| Black | 4 | 0.2% |
| Asian | - | - |
| Hispanic | 1,888 | 99.1% |
| White | 8 | 0.4% |
Number of Students Per Grade
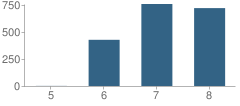
| Number | Percent | |
|---|---|---|
| 5th Grade | 1 | 0.05% |
| 6th Grade | 427 | 22.4% |
| 7th Grade | 758 | 39.8% |
| 8th Grade | 720 | 37.8% |
Teacher Education Background (2009)
Percent With Master's Degree
School:
11.0%
District:
26.9%
Percent With Bachelor's Degree
School:
29.9%
District:
31.9%
Teacher Credentials & Experience (2009)
Percent of Teachers With Credentials: 96.3%
Number of Certificated Staff: 127.0
Average Number of Years of Teacher Experience: 8.3
Average Age
School:
37.1
District:
46.7
Source: CA Department of Education, Source: NCES 2009-2010
School Ratings and Reviews
Be The First To Review Belvedere Middle School!
School Map and Similar Schools Nearby
Click to Activate Map of Nearby School Campuses
Private
Public
This School
Similar Schools Nearby
| Marianna Avenue Elementary School KG-6 | 482 Students | 0.5 miles away | Not Yet Rated | |
| Malabar Street Elementary School KG-6 | 902 Students | 0.8 miles away | Not Yet Rated | |
| Brooklyn Avenue Elementary School KG-6 | 533 Students | 0.9 miles away | Not Yet Rated | |
| Robert F. Kennedy Elementary School KG-6 | 586 Students | 1.0 miles away | Not Yet Rated | |
| Harrison Street Elementary School KG-6 | 657 Students | 1.1 miles away | Not Yet Rated | |
| Robert Louis Stevenson Middle School 6-8 | 2,120 Students | 1.1 miles away | Not Yet Rated | |
| David Wark Griffith Middle School 6-8 | 1,688 Students | 1.2 miles away | Not Yet Rated | |
| Morris K Hamasaki Elementary School KG-6 | 498 Students | 1.3 miles away | Not Yet Rated | |
| Murchison Street Elementary School KG-6 | 572 Students | 1.6 miles away | Not Yet Rated | |
| Sheridan Street Elementary School KG-6 | 1,189 Students | 1.7 miles away |  4 out of 5 | |
Compare This School To Nearby Schools ->
School Community Forum

Join a discussion about Belvedere Middle School and talk to others in the community including students, parents, teachers, and administrators.
Popular Discussion Topics
- Admissions and Registration Questions (e.g. Dress Code and Discipline Policy)
- School Calendar and Upcoming Events (e.g. Graduation)
- After School Programs, Extracurricular Activities, and Athletics (e.g. Football)
- News and Announcements (e.g. Yearbook and Class Supply List Details)
- Graduate and Alumni Events (e.g. Organizing Class Reunions)
Navigation
Can't Find What You Are Looking For?
Rankings
Nearby Cities
Sponsored Links
K-12 Articles

Keep Your Licensed Teen Safe This Summer
Every year hundreds of teenage drivers lose their lives in motor vehicle accidents. Statistics show...
Every year hundreds of teenage drivers lose their lives in motor vehicle accidents. Statistics show...

Does Your Child's Teacher Make a Difference
School improvement is always in the news. Teachers demand smaller class sizes. The government calls...
School improvement is always in the news. Teachers demand smaller class sizes. The government calls...

Strategies to Help Kids Cope with Stress
Many parents believe that kids don’t experience stress. Nothing could be further from the truth....
Many parents believe that kids don’t experience stress. Nothing could be further from the truth....