Monte Cristo Elementary School
Rating
Not Available
Not Available

No Reviews Yet
Find Old Friends From Monte Cristo Elementary School
Use the form below to search for alumni from Monte Cristo Elementary School.
School Description
School Summary and Highlights
- Enrolls 383 preschool and elementary school students from grades PK-6
- Ranks 902nd out of 1,103 elementary schools in WA.
School Operational Details
- Title I EligibleAll students of this school are eligible for participation in authorized programs.
School District Details
- Granite Falls School District
- Per-Pupil Spending: $8,312
- Graduation Rate: 63.6%
- Dropout Rate: 5.2%
- Students Per Teacher: 20.7
- Enrolled Students: 2,314
Faculty Details and Student Enrollment
Students and Faculty
- Total Students Enrolled: 383
- Total Full Time "Equivalent" Teachers: 22.8
- Average Student-To-Teacher Ratio: 16.8
Students Gender Breakdown
- Males: 203 (53.0%)
- Females: 165 (43.1%)
Free Lunch Student Eligibility Breakdown
- Eligible for Reduced Lunch: 36 (9.4%)
- Eligible for Free Lunch: 116 (30.3%)
- Eligible for Either Reduced or Free Lunch: 152 (39.7%)
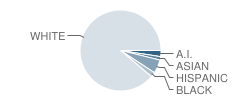
Student Enrollment Distribution by Race / Ethnicity
| Number | Percent | |
|---|---|---|
| American Indian | 9 | 2.3% |
| Black | 7 | 1.8% |
| Asian | 5 | 1.3% |
| Hispanic | 20 | 5.2% |
| White | 327 | 85.4% |
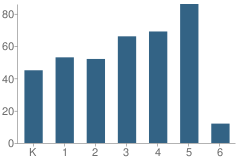
Number of Students Per Grade
| Number | Percent | |
|---|---|---|
| Kindergarten | 45 | 11.7% |
| 1st Grade | 53 | 13.8% |
| 2nd Grade | 52 | 13.6% |
| 3rd Grade | 66 | 17.2% |
| 4th Grade | 69 | 18.0% |
| 5th Grade | 86 | 22.5% |
| 6th Grade | 12 | 3.1% |
Source: WA Department of Education, Source: NCES 2009-2010
School Ratings and Reviews
Be The First To Review Monte Cristo Elementary School!
School Map and Similar Schools Nearby
Click to Activate Map of Nearby School Campuses
Private
Public
This School
Similar Schools Nearby
| Mountain Way Elementary School PK-5 | 601 Students | 0.7 miles away | Not Yet Rated | |
| Granite Falls Middle School 5-8 | 529 Students | 1.0 miles away | Not Yet Rated | |
| Mt. Pilchuck Elementary School PK-5 | 551 Students | 6.0 miles away | Not Yet Rated | |
| Highland Elementary School PK-5 | 578 Students | 6.1 miles away | Not Yet Rated | |
| Sunnycrest Elementary School PK-5 | 631 Students | 6.7 miles away | Not Yet Rated | |
| Machias Elementary School KG-6 | 428 Students | 6.7 miles away | Not Yet Rated | |
| Cedarcrest School 5-8 | 874 Students | 7.4 miles away |  5 out of 5 | |
| Kellogg Marsh Elementary School PK-5 | 610 Students | 7.5 miles away | Not Yet Rated | |
| Grove Elementary School KG-5 | 528 Students | 7.6 miles away | Not Yet Rated | |
| Allen Creek Elementary School PK-5 | 551 Students | 7.8 miles away | Not Yet Rated | |
Compare This School To Nearby Schools ->
School Community Forum

Join a discussion about Monte Cristo Elementary School and talk to others in the community including students, parents, teachers, and administrators.
Popular Discussion Topics
- Admissions and Registration Questions (e.g. Dress Code and Discipline Policy)
- School Calendar and Upcoming Events (e.g. Graduation)
- After School Programs, Extracurricular Activities, and Athletics (e.g. Football)
- News and Announcements (e.g. Yearbook and Class Supply List Details)
- Graduate and Alumni Events (e.g. Organizing Class Reunions)
Navigation
Can't Find What You Are Looking For?
Rankings
Nearby Cities
Sponsored Links
K-12 Articles

Adolescents, Sleep and Learning
Recently, adolescent's sleep habits have been in the news. Research has shown that adolescents need...
Recently, adolescent's sleep habits have been in the news. Research has shown that adolescents need...

Breakfast, Kids and Learning
For generations parents have been telling their kids that breakfast is the most important meal of...
For generations parents have been telling their kids that breakfast is the most important meal of...

School Lunches ... Hot or Cold?
First there were four, now there are six, no one knows how many more there may be in the future....
First there were four, now there are six, no one knows how many more there may be in the future....