Richard E. Byrd Middle School
Rating
Not Available
Not Available

No Reviews Yet
Find Old Friends From Richard E. Byrd Middle School
Use the form below to search for alumni from Richard E. Byrd Middle School.
School Description
School Summary and Highlights
- Enrolls 1,768 middle school students from grades 6-8
- Ranks 1585th out of 2,050 middle schools in CA.
- 2010 Overall School AYP Met Status: No
Additional Contact Information
- Mailing Address: 8501 Arleta Ave., Sun Valley, CA 91352
School Operational Details
- Title I EligibleAll students of this school are eligible for participation in authorized programs.
School District Details
- Los Angeles Unified School District
- Per-Pupil Spending: $11,357
- Graduation Rate: 48.8%
- Dropout Rate: 6.8%
- Students Per Teacher: 21.3
- Enrolled Students: 667,870
Faculty Details and Student Enrollment
Students and Faculty
- Total Students Enrolled: 1,768
- Total Full Time "Equivalent" Teachers: 70.0
- Average Student-To-Teacher Ratio: 25.3
Students Gender Breakdown
- Males: 912 (51.6%)
- Females: 856 (48.4%)
Free Lunch Student Eligibility Breakdown
- Eligible for Reduced Lunch: 157 (8.9%)
- Eligible for Free Lunch: 1,402 (79.3%)
- Eligible for Either Reduced or Free Lunch: 1,559 (88.2%)
Student Enrollment Distribution by Race / Ethnicity
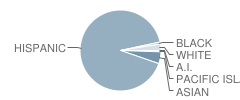
| Number | Percent | |
|---|---|---|
| American Indian | 7 | 0.4% |
| Black | 16 | 0.9% |
| Asian | 85 | 4.8% |
| Hispanic | 1,608 | 91.0% |
| White | 46 | 2.6% |
Number of Students Per Grade
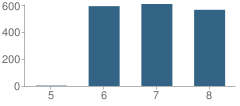
| Number | Percent | |
|---|---|---|
| 5th Grade | 3 | 0.2% |
| 6th Grade | 592 | 33.5% |
| 7th Grade | 608 | 34.4% |
| 8th Grade | 565 | 32.0% |
Teacher Education Background (2009)
Percent With Master's Degree
School:
13.6%
District:
26.9%
Percent With Bachelor's Degree
School:
13.6%
District:
31.9%
Teacher Credentials & Experience (2009)
Percent of Teachers With Credentials: 94.5%
Number of Certificated Staff: 88.0
Average Number of Years of Teacher Experience: 10.9
Average Age
School:
42.5
District:
46.7
Source: CA Department of Education, Source: NCES 2009-2010
School Ratings and Reviews
Be The First To Review Richard E. Byrd Middle School!
School Map and Similar Schools Nearby
Click to Activate Map of Nearby School Campuses
Private
Public
This School
Similar Schools Nearby
| James Madison Middle School 6-8 | 1,609 Students | 1.8 miles away |  5 out of 5 | |
| Sun Valley Middle School 6-8 | 1,457 Students | 2.1 miles away | Not Yet Rated | |
| Pacoima Middle School 6-8 | 1,836 Students | 2.2 miles away | 5 out of 5 | |
| Roy Romer Middle School 6-8 | 1,423 Students | 2.4 miles away | Not Yet Rated | - |
| Arleta High School 6-12 | 1,978 Students | 2.9 miles away | Not Yet Rated | |
| Vista Middle School 6-8 | 1,834 Students | 3.1 miles away | Not Yet Rated | |
| Robert Fulton College Preparatory School 6-12 | 1,910 Students | 3.2 miles away | Not Yet Rated | |
| Charles Maclay Middle School 6-8 | 945 Students | 3.5 miles away | 5 out of 5 | |
| Francisco Sepulveda Middle School 6-8 | 1,485 Students | 3.7 miles away |  4 out of 5 | |
| East Valley Area New High School #1b 8-12 | 1,219 Students | 4.1 miles away | Not Yet Rated | |
Compare This School To Nearby Schools ->
School Community Forum

Join a discussion about Richard E. Byrd Middle School and talk to others in the community including students, parents, teachers, and administrators.
Popular Discussion Topics
- Admissions and Registration Questions (e.g. Dress Code and Discipline Policy)
- School Calendar and Upcoming Events (e.g. Graduation)
- After School Programs, Extracurricular Activities, and Athletics (e.g. Football)
- News and Announcements (e.g. Yearbook and Class Supply List Details)
- Graduate and Alumni Events (e.g. Organizing Class Reunions)
Navigation
Can't Find What You Are Looking For?
Rankings
Nearby Cities
Sponsored Links
K-12 Articles

Democracy in Action
There is still over a year until the general election, but the election cycle has been in full...
There is still over a year until the general election, but the election cycle has been in full...

Summer Safety Tips to Keep Kids Safe
It won't be long until kids run from the school, shrieking in delight because they're free for the...
It won't be long until kids run from the school, shrieking in delight because they're free for the...

Exciting School Lunch Ideas
Earlier this week I had reason to drop by my grandsons' school at lunch time. While waiting for the...
Earlier this week I had reason to drop by my grandsons' school at lunch time. While waiting for the...