Canoga Park High School
- Grades: 9-12
- Student Enrollment: 1,860
Not Available

5 out of 5 | 5 Reviews
Use the form below to search for alumni from Canoga Park High School.
School Description
The mission of Canoga Park High School is to provide a quality education to a diverse student population in order to develop a life long passion for learning, respect for self and others, and a sense of responsibility to society.

Canoga Park High School is a diverse community where all stakeholders, staff, students, and parents endeavor to create a safe learning environment where students have equal access to a quality education. In this learning environment students will develop a respect for the values of education, community, and service. Students will acquire the sense of responsibility and the technical skills necessary to become contributing members of their community and productive citizens of the world.
Faculty Details and Student Enrollment
- Total Students Enrolled: 1,860
- Total Full Time "Equivalent" Teachers: 75.6
- Average Student-To-Teacher Ratio: 24.6
- Males: 978 (52.6%)
- Females: 882 (47.4%)
- Eligible for Reduced Lunch: 145 (7.8%)
- Eligible for Free Lunch: 1,139 (61.2%)
- Eligible for Either Reduced or Free Lunch: 1,284 (69.0%)
| Number | Percent | |
|---|---|---|
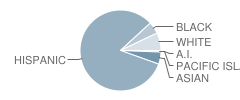
| American Indian | 10 | 0.5% |
| Black | 89 | 4.8% |
| Asian | 90 | 4.8% |
| Hispanic | 1,523 | 81.9% |
| White | 131 | 7.0% |
| Number | Percent | |
|---|---|---|
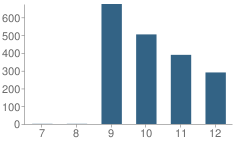
| 7th Grade | 1 | 0.05% |
| 8th Grade | 1 | 0.05% |
| 9th Grade | 675 | 36.3% |
| 10th Grade | 504 | 27.1% |
| 11th Grade | 389 | 20.9% |
| 12th Grade | 290 | 15.6% |
School Ratings and Reviews
Overall Rating: 5

Share Your Review About This School
5 reviews for Canoga Park High School
- Reviewed by Student on November 23, 2010
- Rating:
 (5 / 5) Flag as inappropriate
 - Canoga Park High School, in my eyes was the best choice for me. I love how this school exposes every student to tradition and best yet how to become a predictive member to society. Canoga offers a lot of academic programs to student who are interstead in different fields of interest for example, avid, bait, farming magnet, and business magnet. Here at Canoga you will find an individual who will assist toy in any problem you may encounter. This school is also very diverse and to me that is important, because student learn to ineract with different kinds of people. If I would choose a school for my son or daughter I would not think twice in choosing this school. I am and forever will be a Hunter graduate class of 2011!
- Reviewed by Student on September 24, 2010
- Rating: (5 / 5) Flag as inappropriate
- this school is really good all the staff are supportive and they try to lead you into the right direction. i have been going to Canoga since 9th grade and i'm graduating this year ...LETS GO HUNTERS .... HUNTER PRIDE FOREVER
- Reviewed by Parent/Guardian on July 31, 2010
- Rating: (5 / 5) Flag as inappropriate
- The worst school ever!!! The councelors don't care about their magnet student's..Do not bus your child here you will truely regret it! I requested an I.E.P. for my child over 5 times . The councelor lied to me over and over again. The teachers just gave her fails all school year. The only thing the staff at this schoolcare about is their paychecks!! Run as fast and as far away from this school as you can. A hurt and disapointed Parent .
- Reviewed by Student on October 04, 2009
- Rating: (5 / 5) Flag as inappropriate
- GO HUNTERS
BEST SCHOOL EVER!!! I LOVE IT :)
- Reviewed by Student on February 06, 2008
- Rating: (5 / 5) Flag as inappropriate
- Best school ever!!!
Go Hunters!
School Map and Similar Schools Nearby
| William Howard Taft High School 9-12 | 2,749 Students | 2.7 miles away |  5 out of 5 | |
| El Camino Real High School 9-12 | 3,513 Students | 2.8 miles away | 5 out of 5 | |
| Grover Cleveland High School 9-12 | 3,861 Students | 3.6 miles away | Not Yet Rated | |
| Calabasas High School 9-12 | 1,981 Students | 4.1 miles away | Not Yet Rated | |
| Chatsworth High School 9-12 | 3,129 Students | 4.1 miles away | 5 out of 5 | |
| Reseda High School 9-12 | 2,152 Students | 4.3 miles away |  4 out of 5 | |
| Daniel Pearl Journalism & Communications Magnet School 9-12 | 333 Students | 5.8 miles away | Not Yet Rated | - |
| Northridge Academy High 9-12 | 1,061 Students | 5.8 miles away |  2 out of 5 | |
| James Monroe High School 9-12 | 2,749 Students | 8.0 miles away | 5 out of 5 | |
| Robert Fulton College Preparatory School 6-12 | 1,910 Students | 8.5 miles away | Not Yet Rated | |
School Community Forum

Join a discussion about Canoga Park High School and talk to others in the community including students, parents, teachers, and administrators.
- Admissions and Registration Questions (e.g. Dress Code and Discipline Policy)
- School Calendar and Upcoming Events (e.g. Graduation)
- After School Programs, Extracurricular Activities, and Athletics (e.g. Football)
- News and Announcements (e.g. Yearbook and Class Supply List Details)
- Graduate and Alumni Events (e.g. Organizing Class Reunions)

It won't be long until kids run from the school, shrieking in delight because they're free for the...

Transitions are rarely easy, yet we have to encounter them every day of our lives. For school-aged...

Recently, radio talk show host and CNN personality did a week-long special entitled "The Perfect...