Glenn Hammond Curtiss Middle School
Rating
Not Available
Not Available

No Reviews Yet
Find Old Friends From Glenn Hammond Curtiss Middle School
Use the form below to search for alumni from Glenn Hammond Curtiss Middle School.
School Description
School Summary and Highlights
- Enrolls 964 middle school students from grades 6-8
- Ranks 1973rd out of 2,050 middle schools in CA.
- 2010 Overall School AYP Met Status: No
Additional Contact Information
- Mailing Address: 1254 East Helmick St., Carson, CA 90746
School Operational Details
- Title I EligibleAll students of this school are eligible for participation in authorized programs.
School District Details
- Los Angeles Unified School District
- Per-Pupil Spending: $11,357
- Graduation Rate: 48.8%
- Dropout Rate: 6.8%
- Students Per Teacher: 21.3
- Enrolled Students: 667,870
Faculty Details and Student Enrollment
Students and Faculty
- Total Students Enrolled: 964
- Total Full Time "Equivalent" Teachers: 50.7
- Average Student-To-Teacher Ratio: 19.0
Students Gender Breakdown
- Males: 471 (48.9%)
- Females: 493 (51.1%)
Free Lunch Student Eligibility Breakdown
- Eligible for Reduced Lunch: 77 (8.0%)
- Eligible for Free Lunch: 635 (65.9%)
- Eligible for Either Reduced or Free Lunch: 712 (73.9%)
Student Enrollment Distribution by Race / Ethnicity
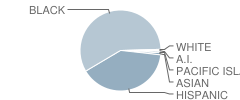
| Number | Percent | |
|---|---|---|
| American Indian | 5 | 0.5% |
| Black | 550 | 57.1% |
| Asian | 9 | 0.9% |
| Hispanic | 377 | 39.1% |
| White | 6 | 0.6% |
Number of Students Per Grade
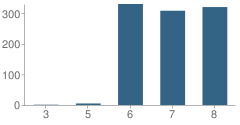
| Number | Percent | |
|---|---|---|
| 3rd Grade | 1 | 0.1% |
| 5th Grade | 5 | 0.5% |
| 6th Grade | 330 | 34.2% |
| 7th Grade | 308 | 32.0% |
| 8th Grade | 320 | 33.2% |
Teacher Education Background (2009)
Percent With Ph.D.
School:
2.9%
District:
3.7%
Percent With Master's Degree
School:
14.7%
District:
26.9%
Percent With Bachelor's Degree
School:
16.2%
District:
31.9%
Teacher Credentials & Experience (2009)
Percent of Teachers With Credentials: 98.2%
Number of Certificated Staff: 68.0
Average Number of Years of Teacher Experience: 7.7
Average Age
School:
44.0
District:
46.7
Source: CA Department of Education, Source: NCES 2009-2010
School Ratings and Reviews
Be The First To Review Glenn Hammond Curtiss Middle School!
School Map and Similar Schools Nearby
Click to Activate Map of Nearby School Campuses
Private
Public
This School
Similar Schools Nearby
| Andrew Carnegie Middle School 6-8 | 1,433 Students | 1.6 miles away | Not Yet Rated | |
| Walton Middle School 6-8 | 569 Students | 2.1 miles away |  4.5 out of 5 | |
| Stephen M. White Middle School 6-8 | 1,849 Students | 2.7 miles away | Not Yet Rated | |
| Colin L. Powell Academy for Success KG-8 | 1,159 Students | 2.8 miles away | Not Yet Rated | |
| Caroldale Learning Community School KG-8 | 777 Students | 2.8 miles away | Not Yet Rated | |
| Lindsey (Perry) Academy 6-8 | 916 Students | 2.9 miles away | Not Yet Rated | - |
| Enterprise Middle School 6-8 | 603 Students | 3.1 miles away |  5 out of 5 | |
| Roosevelt Middle School 6-8 | 1,153 Students | 3.4 miles away | 5 out of 5 | |
| Davis Middle School 6-8 | 1,220 Students | 3.5 miles away | Not Yet Rated | |
| Stephens Middle School 6-8 | 1,004 Students | 3.5 miles away | Not Yet Rated | |
Compare This School To Nearby Schools ->
School Community Forum

Join a discussion about Glenn Hammond Curtiss Middle School and talk to others in the community including students, parents, teachers, and administrators.
Popular Discussion Topics
- Admissions and Registration Questions (e.g. Dress Code and Discipline Policy)
- School Calendar and Upcoming Events (e.g. Graduation)
- After School Programs, Extracurricular Activities, and Athletics (e.g. Football)
- News and Announcements (e.g. Yearbook and Class Supply List Details)
- Graduate and Alumni Events (e.g. Organizing Class Reunions)
Navigation
Can't Find What You Are Looking For?
Rankings
Nearby Cities
Sponsored Links
K-12 Articles

Keep Your Licensed Teen Safe This Summer
Every year hundreds of teenage drivers lose their lives in motor vehicle accidents. Statistics show...
Every year hundreds of teenage drivers lose their lives in motor vehicle accidents. Statistics show...

Teachers Packing Heat
After the recent school shootings (and thwarted school shootings) in the past month-just as after...
After the recent school shootings (and thwarted school shootings) in the past month-just as after...

Tips for Purchasing Back to School Supplies
In just a few days, kids from all over the US will be going back to school. Now is the time to take...
In just a few days, kids from all over the US will be going back to school. Now is the time to take...