Susan Miller Dorsey High School
Rating
Not Available
Not Available

No Reviews Yet
Find Old Friends From Susan Miller Dorsey High School
Use the form below to search for alumni from Susan Miller Dorsey High School.
School Description
School Summary and Highlights
- Enrolls 1,681 high school students from grades 9-12
- Ranks 1134th out of 1,197 high schools in CA.
- 2010 Overall School AYP Met Status: No
Additional Contact Information
- Mailing Address: 3537 Farmdale Ave., Los Angeles, CA 90016
School Operational Details
- Title I EligibleAll students of this school are eligible for participation in authorized programs.
School District Details
- Los Angeles Unified School District
- Per-Pupil Spending: $11,357
- Graduation Rate: 48.8%
- Dropout Rate: 6.8%
- Students Per Teacher: 21.3
- Enrolled Students: 667,870
Faculty Details and Student Enrollment
Students and Faculty
- Total Students Enrolled: 1,681
- Total Full Time "Equivalent" Teachers: 85.1
- Average Student-To-Teacher Ratio: 19.8
Students Gender Breakdown
- Males: 899 (53.5%)
- Females: 782 (46.5%)
Free Lunch Student Eligibility Breakdown
- Eligible for Reduced Lunch: 78 (4.6%)
- Eligible for Free Lunch: 1,055 (62.8%)
- Eligible for Either Reduced or Free Lunch: 1,133 (67.4%)
Student Enrollment Distribution by Race / Ethnicity
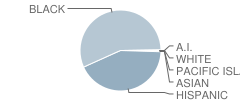
| Number | Percent | |
|---|---|---|
| American Indian | 3 | 0.2% |
| Black | 943 | 56.1% |
| Asian | 5 | 0.3% |
| Hispanic | 714 | 42.5% |
| White | 5 | 0.3% |
Number of Students Per Grade
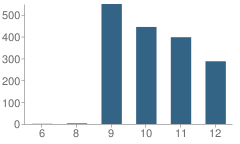
| Number | Percent | |
|---|---|---|
| 6th Grade | 1 | 0.06% |
| 8th Grade | 3 | 0.2% |
| 9th Grade | 549 | 32.7% |
| 10th Grade | 444 | 26.4% |
| 11th Grade | 397 | 23.6% |
| 12th Grade | 287 | 17.1% |
Graduates Information (2010)
Graduation Rate
School:
63.2%
District:
69.1%
State:
78.6%
Teacher Education Background (2009)
Percent With Master's Degree
School:
15.3%
District:
26.9%
Percent With Bachelor's Degree
School:
28.8%
District:
31.9%
Percent With Ph.D.
School:
90.1%
District:
3.7%
Teacher Credentials & Experience (2009)
Average Age
School:
41.8
District:
46.7
Average Number of Years of Teacher Experience: 9.7
Number of Certificated Staff: 111.0
Percent of Teachers With Credentials: 94.7%
Source: CA Department of Education, Source: NCES 2009-2010
School Ratings and Reviews
Be The First To Review Susan Miller Dorsey High School!
School Map and Similar Schools Nearby
Click to Activate Map of Nearby School Campuses
Private
Public
This School
Similar Schools Nearby
| Crenshaw High School 9-12 | 1,788 Students | 2.0 miles away |  4.5 out of 5 | |
| Foshay Learning Center School KG-12 | 2,837 Students | 2.3 miles away |  5 out of 5 | |
| Los Angeles High School 9-12 | 2,855 Students | 2.4 miles away | Not Yet Rated | |
| Alexander Hamilton High School 9-12 | 3,083 Students | 2.6 miles away | 5 out of 5 | |
| Manual Arts High School 9-12 | 3,499 Students | 3.3 miles away | Not Yet Rated | |
| Culver City High School 9-12 | 2,324 Students | 3.4 miles away | Not Yet Rated | |
| West Adams Preparatory High School 9-12 | 2,618 Students | 3.4 miles away | Not Yet Rated | - |
| Inglewood High School 9-12 | 1,627 Students | 4.3 miles away | Not Yet Rated | |
| City Honors High School 9-12 | 456 Students | 4.5 miles away | 5 out of 5 | |
| Beverly Hills High School 9-12 | 2,201 Students | 4.6 miles away | Not Yet Rated | |
Compare This School To Nearby Schools ->
School Community Forum

Join a discussion about Susan Miller Dorsey High School and talk to others in the community including students, parents, teachers, and administrators.
Popular Discussion Topics
- Admissions and Registration Questions (e.g. Dress Code and Discipline Policy)
- School Calendar and Upcoming Events (e.g. Graduation)
- After School Programs, Extracurricular Activities, and Athletics (e.g. Football)
- News and Announcements (e.g. Yearbook and Class Supply List Details)
- Graduate and Alumni Events (e.g. Organizing Class Reunions)
Navigation
Can't Find What You Are Looking For?
Rankings
Sponsored Links
K-12 Articles

Tips for Purchasing Back to School Supplies
In just a few days, kids from all over the US will be going back to school. Now is the time to take...
In just a few days, kids from all over the US will be going back to school. Now is the time to take...

Those Pesky Little Transitions
Transitions are rarely easy, yet we have to encounter them every day of our lives. For school-aged...
Transitions are rarely easy, yet we have to encounter them every day of our lives. For school-aged...

Your Child and School Corporal Punishment
Your child comes home at the end of the school day with a huge bruise on his upper arm. When you...
Your child comes home at the end of the school day with a huge bruise on his upper arm. When you...