El Camino Real High School
5440 Valley Circle Blvd, Woodland Hills, CA 91367 | (818) 595-7500
- Grades: 9-12
- Student Enrollment: 3,513

5 out of 5 | 2 Reviews
Find Old Friends From El Camino Real High School
Use the form below to search for alumni from El Camino Real High School.
School Description
School Summary and Highlights
- Enrolls 3,513 high school students from grades 9-12
- Ranks 169th out of 1,197 high schools in CA.
- 2010 Overall School AYP Met Status: No
Additional Contact Information
- Mailing Address: 5440 Valley Cir. Blvd., Woodland Hills, CA 91367
School District Details
- Los Angeles Unified School District
- Per-Pupil Spending: $11,357
- Graduation Rate: 48.8%
- Dropout Rate: 6.8%
- Students Per Teacher: 21.3
- Enrolled Students: 667,870
Faculty Details and Student Enrollment
Students and Faculty
- Total Students Enrolled: 3,513
- Total Full Time "Equivalent" Teachers: 119.6
- Average Student-To-Teacher Ratio: 29.4
Students Gender Breakdown
- Males: 1,820 (51.8%)
- Females: 1,693 (48.2%)
Free Lunch Student Eligibility Breakdown
- Eligible for Reduced Lunch: 164 (4.7%)
- Eligible for Free Lunch: 655 (18.6%)
- Eligible for Either Reduced or Free Lunch: 819 (23.3%)
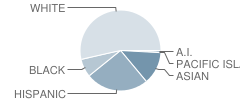
Student Enrollment Distribution by Race / Ethnicity

| Number | Percent | |
|---|---|---|
| American Indian | 26 | 0.7% |
| Black | 252 | 7.2% |
| Asian | 451 | 12.8% |
| Hispanic | 869 | 24.7% |
| White | 1,839 | 52.3% |
Number of Students Per Grade

| Number | Percent | |
|---|---|---|
| 6th Grade | 1 | 0.03% |
| 8th Grade | 4 | 0.1% |
| 9th Grade | 956 | 27.2% |
| 10th Grade | 900 | 25.6% |
| 11th Grade | 897 | 25.5% |
| 12th Grade | 754 | 21.5% |
| Ungraded | 1 | 0.03% |
Graduates Information (2010)
Graduation Rate
School:
91.4%
District:
69.1%
State:
78.6%
Teacher Education Background (2009)
Percent With Ph.D.
School:
1.4%
District:
3.7%
Percent With Master's Degree
School:
9.1%
District:
26.9%
Percent With Bachelor's Degree
School:
4.2%
District:
31.9%
Teacher Credentials & Experience (2009)
Percent of Teachers With Credentials: 97.6%
Number of Certificated Staff: 143.0
Average Number of Years of Teacher Experience: 12.7
Average Age
School:
45.1
District:
46.7
Source: CA Department of Education, Source: NCES 2009-2010
Sponsored Links
Test Scores and Performance Information
Overall School Rating
How is this determined?
The overall school rating shows that El Camino Real High School performed on average better than many other schools across the state on CST state exams in the following subjects:
- CST Algebra I
- CST Algebra II
- CST Biology
- CST Chemistry
- CST Earth Science
- CST English-Language Arts
- CST General Mathematics
- CST Geometry
- CST Integrated/Coordinated Science
- CST Physics
- CST Science
- CST Summative High School Math
- CST U.S. History
- CST World History
AYP Results (2010)
Overall AYP Met: No
ELA AYP Met: No
Math AYP Met: No
ACT Exam Results (2009)
Percent of Students Taking ACT Exam: 19.1%
Average Combined Score: 23.9
Percent Scoring At or Above 21: 76.0%
SAT Exam Results (2009)
Percent of Students Taking SAT Exam: 55.9%
Average Combined Score: 1,583.4
Critical Reading Average: 521.2
Math Average: 532.8
Writing Average: 529.5
Percent Scoring At or Above 1500: 59.3%
CST - Test Proficiency by Grade and Subject
Grade 9 - % of students at or above proficiency
| School | District | State | |
|---|---|---|---|
| CST Algebra I Test | |||
| 2010 | 49.0% | 11.0% | 22.0% |
| 2009 | 47.0% | 10.0% | 21.0% |
| 2008 | 45.0% | 9.0% | 18.0% |
| CST Algebra II Test | |||
| 2010 | 89.0% | 42.0% | 69.0% |
| 2009 | 78.0% | 36.0% | 65.0% |
| 2008 | 73.0% | 36.0% | 66.0% |
| CST Biology Test | |||
| 2010 | 80.0% | 27.0% | 55.0% |
| 2009 | 78.0% | 23.0% | 51.0% |
| 2008 | 71.0% | 25.0% | 52.0% |
| CST English-Language Arts Test | |||
| 2010 | 76.0% | 36.0% | 54.0% |
| 2009 | 71.0% | 32.0% | 50.0% |
| 2008 | 69.0% | 31.0% | 49.0% |
| CST General Mathematics Test | |||
| 2010 | 32.0% | 13.0% | 17.0% |
| 2009 | 26.0% | 13.0% | 17.0% |
| 2008 | 22.0% | 11.0% | 18.0% |
| CST Geometry Test | |||
| 2010 | 77.0% | 21.0% | 46.0% |
| 2009 | 80.0% | 23.0% | 47.0% |
| 2008 | 78.0% | 19.0% | 43.0% |
| CST Integrated/Coordinated Science Test | |||
| 2010 | 7.0% | 13.0% | 19.0% |
| 2009 | - | - | - |
| 2008 | 4.0% | 7.0% | 5.0% |
| CST World History Test | |||
| 2010 | 64.0% | 21.0% | 45.0% |
| 2009 | 57.0% | 18.0% | 41.0% |
| 2008 | 43.0% | 15.0% | 36.0% |
Grade 10 - % of students at or above proficiency
| School | District | State | |
|---|---|---|---|
| CST Algebra I Test | |||
| 2010 | 11.0% | 8.0% | 12.0% |
| 2009 | 8.0% | 6.0% | 11.0% |
| 2008 | 10.0% | 5.0% | 9.0% |
| CST Algebra II Test | |||
| 2010 | 57.0% | 21.0% | 40.0% |
| 2009 | 55.0% | 18.0% | 37.0% |
| 2008 | 61.0% | 17.0% | 36.0% |
| CST Biology Test | |||
| 2010 | 56.0% | 29.0% | 38.0% |
| 2009 | 42.0% | 24.0% | 34.0% |
| 2008 | 45.0% | 23.0% | 35.0% |
| CST Chemistry Test | |||
| 2010 | 50.0% | 17.0% | 47.0% |
| 2009 | 34.0% | 15.0% | 44.0% |
| 2008 | 22.0% | 13.0% | 41.0% |
| CST English-Language Arts Test | |||
| 2010 | 64.0% | 33.0% | 45.0% |
| 2009 | 60.0% | 31.0% | 44.0% |
| 2008 | 59.0% | 29.0% | 41.0% |
| CST Geometry Test | |||
| 2010 | 40.0% | 6.0% | 14.0% |
| 2009 | 31.0% | 6.0% | 14.0% |
| 2008 | 37.0% | 5.0% | 12.0% |
| CST Science Test | |||
| 2010 | 61.0% | 32.0% | 46.0% |
| 2009 | 51.0% | 30.0% | 44.0% |
| 2008 | 50.0% | 25.0% | 40.0% |
| CST Summative High School Math Test | |||
| 2010 | 78.0% | 53.0% | 75.0% |
| 2009 | 74.0% | 42.0% | 71.0% |
| 2008 | 70.0% | 44.0% | 68.0% |
| CST World History Test | |||
| 2010 | 50.0% | 28.0% | 42.0% |
| 2009 | 38.0% | 24.0% | 38.0% |
| 2008 | 34.0% | 19.0% | 33.0% |
Grade 11 - % of students at or above proficiency
| School | District | State | |
|---|---|---|---|
| CST Algebra I Test | |||
| 2010 | 5.0% | 6.0% | 8.0% |
| 2009 | 3.0% | 6.0% | 8.0% |
| 2008 | 9.0% | 5.0% | 5.0% |
| CST Algebra II Test | |||
| 2010 | 14.0% | 6.0% | 14.0% |
| 2009 | 15.0% | 6.0% | 12.0% |
| 2008 | 18.0% | 5.0% | 11.0% |
| CST Biology Test | |||
| 2010 | 64.0% | 29.0% | 46.0% |
| 2009 | 58.0% | 26.0% | 41.0% |
| 2008 | 64.0% | 26.0% | 39.0% |
| CST Chemistry Test | |||
| 2010 | 24.0% | 15.0% | 30.0% |
| 2009 | 22.0% | 13.0% | 27.0% |
| 2008 | 17.0% | 11.0% | 25.0% |
| CST Earth Science Test | |||
| 2010 | 72.0% | 36.0% | 32.0% |
| 2009 | 67.0% | 34.0% | 26.0% |
| 2008 | 89.0% | 29.0% | 28.0% |
| CST English-Language Arts Test | |||
| 2010 | 59.0% | 34.0% | 42.0% |
| 2009 | 56.0% | 32.0% | 40.0% |
| 2008 | 60.0% | 27.0% | 37.0% |
| CST Geometry Test | |||
| 2010 | 10.0% | 3.0% | 6.0% |
| 2009 | 15.0% | 3.0% | 7.0% |
| 2008 | 10.0% | 2.0% | 6.0% |
| CST Physics Test | |||
| 2010 | 87.0% | 26.0% | 53.0% |
| 2009 | 79.0% | 22.0% | 50.0% |
| 2008 | 50.0% | 19.0% | 47.0% |
| CST Summative High School Math Test | |||
| 2010 | 72.0% | 31.0% | 50.0% |
| 2009 | 61.0% | 27.0% | 47.0% |
| 2008 | 63.0% | 25.0% | 43.0% |
| CST U.S. History Test | |||
| 2010 | 52.0% | 33.0% | 45.0% |
| 2009 | 51.0% | 31.0% | 44.0% |
| 2008 | 49.0% | 25.0% | 38.0% |
| CST World History Test | |||
| 2010 | 27.0% | 14.0% | 15.0% |
| 2009 | 4.0% | 8.0% | 11.0% |
| 2008 | 5.0% | 7.0% | 9.0% |
End of Course - % of students at or above proficiency
| School | District | State | |
|---|---|---|---|
| CST Algebra I Test | |||
| 2010 | 37.0% | 22.0% | 31.0% |
| 2009 | 33.0% | 19.0% | 28.0% |
| 2008 | 32.0% | 17.0% | 25.0% |
| CST Algebra II Test | |||
| 2010 | 40.0% | 16.0% | 31.0% |
| 2009 | 38.0% | 15.0% | 28.0% |
| 2008 | 40.0% | 13.0% | 27.0% |
| CST Biology Test | |||
| 2010 | 65.0% | 28.0% | 46.0% |
| 2009 | 55.0% | 24.0% | 42.0% |
| 2008 | 55.0% | 24.0% | 42.0% |
| CST Chemistry Test | |||
| 2010 | 28.0% | 16.0% | 38.0% |
| 2009 | 25.0% | 14.0% | 36.0% |
| 2008 | 18.0% | 12.0% | 32.0% |
| CST Earth Science Test | |||
| 2010 | 72.0% | 30.0% | 33.0% |
| 2009 | 65.0% | 25.0% | 28.0% |
| 2008 | 88.0% | 21.0% | 28.0% |
| CST General Mathematics Test | |||
| 2010 | 32.0% | 20.0% | 27.0% |
| 2009 | 26.0% | 17.0% | 26.0% |
| 2008 | 22.0% | 15.0% | 27.0% |
| CST Geometry Test | |||
| 2010 | 51.0% | 14.0% | 27.0% |
| 2009 | 47.0% | 14.0% | 26.0% |
| 2008 | 47.0% | 11.0% | 24.0% |
| CST Integrated/Coordinated Science Test | |||
| 2010 | 6.0% | 3.0% | 16.0% |
| 2009 | - | - | - |
| 2008 | 4.0% | 2.0% | 11.0% |
| CST Physics Test | |||
| 2010 | 88.0% | 24.0% | 49.0% |
| 2009 | 78.0% | 20.0% | 46.0% |
| 2008 | 51.0% | 18.0% | 43.0% |
| CST Summative High School Math Test | |||
| 2010 | 73.0% | 35.0% | 54.0% |
| 2009 | 63.0% | 30.0% | 50.0% |
| 2008 | 64.0% | 29.0% | 47.0% |
| CST World History Test | |||
| 2010 | 54.0% | 27.0% | 41.0% |
| 2009 | 43.0% | 23.0% | 38.0% |
| 2008 | 35.0% | 18.0% | 33.0% |
Source: CA Department of Education 2009-2010
School Map and Similar Schools Nearby
Click to Activate Map of Nearby School Campuses
Private
Public
This School
Similar Schools Nearby
| Calabasas High School 9-12 | 1,981 Students | 2.4 miles away | Not Yet Rated | |
| Canoga Park High School 9-12 | 1,860 Students | 2.8 miles away | ![]() 5 out of 5 | |
| William Howard Taft High School 9-12 | 2,749 Students | 4.1 miles away | ![]() 5 out of 5 | |
| Agoura High School 9-12 | 2,161 Students | 6.1 miles away | Not Yet Rated | |
| Grover Cleveland High School 9-12 | 3,861 Students | 6.4 miles away | Not Yet Rated | |
| Reseda High School 9-12 | 2,152 Students | 6.6 miles away | ![]() 4 out of 5 | |
| Chatsworth High School 9-12 | 3,129 Students | 6.7 miles away | ![]() 5 out of 5 | |
| Oak Park High School 9-12 | 1,307 Students | 7.0 miles away | Not Yet Rated | |
| Daniel Pearl Journalism & Communications Magnet School 9-12 | 333 Students | 8.0 miles away | Not Yet Rated | - |
| Northridge Academy High 9-12 | 1,061 Students | 8.6 miles away | ![]() 2 out of 5 | |
Compare This School To Nearby Schools ->
School Community Forum

Join a discussion about El Camino Real High School and talk to others in the community including students, parents, teachers, and administrators.
Popular Discussion Topics
- Admissions and Registration Questions (e.g. Dress Code and Discipline Policy)
- School Calendar and Upcoming Events (e.g. Graduation)
- After School Programs, Extracurricular Activities, and Athletics (e.g. Football)
- News and Announcements (e.g. Yearbook and Class Supply List Details)
- Graduate and Alumni Events (e.g. Organizing Class Reunions)
Navigation
Can't Find What You Are Looking For?
Rankings
Nearby Cities
Sponsored Links
K-12 Articles
Choosing a Summer Camp for Your Child
Are you planning to send your child to summer camp this year? If so, have you taken his needs into...
Teaching Children a Love of History
Parents and grandparents are responsible for teaching children a love of history. To begin, relate...
Teaching Your Kids About Respect, Values and Violence
These days it seems that every newscast reports at least once incident of violence. As parents, we...


(5 / 5) 

