Elizabeth Learning Center School
Rating
Not Available
Not Available

No Reviews Yet
Find Old Friends From Elizabeth Learning Center School
Use the form below to search for alumni from Elizabeth Learning Center School.
School Description
School Summary and Highlights
- Enrolls 2,117 elementary, middle, and high school students from grades KG-12
- Ranks 825th out of 1,197 high schools in CA.
- 2010 Overall School AYP Met Status: No
Additional Contact Information
- Mailing Address: 4811 Elizabeth St., Cudahy, CA 90201
School Operational Details
- Title I EligibleAll students of this school are eligible for participation in authorized programs.
School District Details
- Los Angeles Unified School District
- Per-Pupil Spending: $11,357
- Graduation Rate: 48.8%
- Dropout Rate: 6.8%
- Students Per Teacher: 21.3
- Enrolled Students: 667,870
Faculty Details and Student Enrollment
Students and Faculty
- Total Students Enrolled: 2,117
- Total Full Time "Equivalent" Teachers: 122.4
- Average Student-To-Teacher Ratio: 17.3
Students Gender Breakdown
- Males: 1,001 (47.3%)
- Females: 1,116 (52.7%)
Free Lunch Student Eligibility Breakdown
- Eligible for Reduced Lunch: 122 (5.8%)
- Eligible for Free Lunch: 1,992 (94.1%)
- Eligible for Either Reduced or Free Lunch: 2,114 (99.9%)
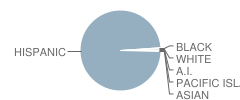
Student Enrollment Distribution by Race / Ethnicity
| Number | Percent | |
|---|---|---|
| American Indian | 6 | 0.3% |
| Black | 9 | 0.4% |
| Asian | 2 | 0.09% |
| Hispanic | 2,084 | 98.4% |
| White | 15 | 0.7% |
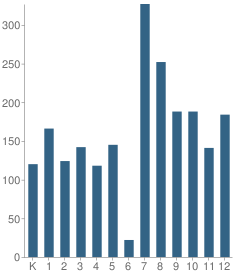
Number of Students Per Grade
| Number | Percent | |
|---|---|---|
| Kindergarten | 120 | 5.7% |
| 1st Grade | 166 | 7.8% |
| 2nd Grade | 124 | 5.9% |
| 3rd Grade | 142 | 6.7% |
| 4th Grade | 118 | 5.6% |
| 5th Grade | 145 | 6.8% |
| 6th Grade | 22 | 1.0% |
| 7th Grade | 327 | 15.4% |
| 8th Grade | 252 | 11.9% |
| 9th Grade | 188 | 8.9% |
| 10th Grade | 188 | 8.9% |
| 11th Grade | 141 | 6.7% |
| 12th Grade | 184 | 8.7% |
Graduates Information (2010)
Graduation Rate
School:
85.7%
District:
69.1%
State:
78.6%
Teacher Education Background (2009)
Percent With Master's Degree
School:
12.2%
District:
26.9%
Percent With Bachelor's Degree
School:
20.3%
District:
31.9%
Percent With Ph.D.
School:
1.4%
District:
3.7%
Teacher Credentials & Experience (2009)
Average Age
School:
40.3
District:
46.7
Average Number of Years of Teacher Experience: 10.3
Number of Certificated Staff: 148.0
Percent of Teachers With Credentials: 99.2%
Source: CA Department of Education, Source: NCES 2009-2010
School Ratings and Reviews
Be The First To Review Elizabeth Learning Center School!
School Map and Similar Schools Nearby
Click to Activate Map of Nearby School Campuses
Private
Public
This School
Similar Schools Nearby
| Bell High School 9-12 | 4,301 Students | 0.9 miles away |  4.5 out of 5 | |
| Maywood Academy High 9-12 | 1,343 Students | 1.5 miles away |  5 out of 5 | |
| South Gate High School 9-12 | 3,289 Students | 1.7 miles away | 4.5 out of 5 | |
| Bell Gardens High School 9-12 | 3,570 Students | 1.8 miles away | Not Yet Rated | |
| South East High School 9-12 | 2,855 Students | 2.6 miles away | 5 out of 5 | |
| Huntington Park High School 9-12 | 4,185 Students | 2.7 miles away |  2 out of 5 | |
| International Studies Learning Community School 6-12 | 782 Students | 2.8 miles away | Not Yet Rated | |
| Warren High School 9-12 | 3,666 Students | 3.1 miles away |  4 out of 5 | |
| Jordan New Technology High School 9-12 | 237 Students | 3.1 miles away | Not Yet Rated | - |
| Downey High School 9-12 | 4,016 Students | 3.6 miles away | Not Yet Rated | |
Compare This School To Nearby Schools ->
School Community Forum

Join a discussion about Elizabeth Learning Center School and talk to others in the community including students, parents, teachers, and administrators.
Popular Discussion Topics
- Admissions and Registration Questions (e.g. Dress Code and Discipline Policy)
- School Calendar and Upcoming Events (e.g. Graduation)
- After School Programs, Extracurricular Activities, and Athletics (e.g. Football)
- News and Announcements (e.g. Yearbook and Class Supply List Details)
- Graduate and Alumni Events (e.g. Organizing Class Reunions)
Navigation
Can't Find What You Are Looking For?
Rankings
Nearby Cities
Sponsored Links
K-12 Articles

Internet Safety for Kids of All Ages
Kids are being introduced to the Internet at a very young age. Research for homework and school...
Kids are being introduced to the Internet at a very young age. Research for homework and school...

Teaching Your Kids About Respect, Values and Violence
These days it seems that every newscast reports at least once incident of violence. As parents, we...
These days it seems that every newscast reports at least once incident of violence. As parents, we...

Bullies... What Are They Good For?
Bullies have been around since the beginning of time. We had to deal with bullies, and our parents...
Bullies have been around since the beginning of time. We had to deal with bullies, and our parents...