Benjamin Franklin High School

No Reviews Yet
Find Old Friends From Benjamin Franklin High School
Use the form below to search for alumni from Benjamin Franklin High School.
School Description
School Summary and Highlights
- Enrolls 2,514 high school students from grades 9-12
- Ranks 979th out of 1,197 high schools in CA.
- 2010 Overall School AYP Met Status: No
Additional Contact Information
- Mailing Address: 820 North Avenue 54, Los Angeles, CA 90042
School Operational Details
- Title I EligibleAll students of this school are eligible for participation in authorized programs.
School District Details
- Los Angeles Unified School District
- Per-Pupil Spending: $11,357
- Graduation Rate: 48.8%
- Dropout Rate: 6.8%
- Students Per Teacher: 21.3
- Enrolled Students: 667,870
Faculty Details and Student Enrollment
Students and Faculty
- Total Students Enrolled: 2,514
- Total Full Time "Equivalent" Teachers: 99.0
- Average Student-To-Teacher Ratio: 25.4
Students Gender Breakdown
- Males: 1,328 (52.8%)
- Females: 1,186 (47.2%)
Free Lunch Student Eligibility Breakdown
- Eligible for Reduced Lunch: 221 (8.8%)
- Eligible for Free Lunch: 1,731 (68.9%)
- Eligible for Either Reduced or Free Lunch: 1,952 (77.6%)
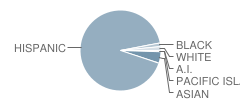
Student Enrollment Distribution by Race / Ethnicity

| Number | Percent | |
|---|---|---|
| American Indian | 12 | 0.5% |
| Black | 36 | 1.4% |
| Asian | 114 | 4.5% |
| Hispanic | 2,279 | 90.7% |
| White | 39 | 1.6% |
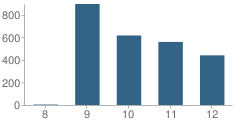
Number of Students Per Grade

| Number | Percent | |
|---|---|---|
| 8th Grade | 4 | 0.2% |
| 9th Grade | 895 | 35.6% |
| 10th Grade | 616 | 24.5% |
| 11th Grade | 559 | 22.2% |
| 12th Grade | 440 | 17.5% |
Graduates Information (2010)
Graduation Rate
School:
67.7%
District:
69.1%
State:
78.6%
Teacher Education Background (2009)
Percent With Ph.D.
School:
1.4%
District:
3.7%
Percent With Master's Degree
School:
8.8%
District:
26.9%
Percent With Bachelor's Degree
School:
10.9%
District:
31.9%
Teacher Credentials & Experience (2009)
Percent of Teachers With Emergency Credentials: 0.8%
Percent of Teachers With Credentials: 97.6%
Number of Certificated Staff: 147.0
Average Number of Years of Teacher Experience: 14.5
Average Age
School:
44.3
District:
46.7
Source: CA Department of Education, Source: NCES 2009-2010
School Ratings and Reviews
Be The First To Review Benjamin Franklin High School!
Sponsored Links
Test Scores and Performance Information
Overall School Rating
How is this determined?
The overall school rating shows that Benjamin Franklin High School performed on average worse than many other schools across the state on CST state exams in the following subjects:
- CST Algebra I
- CST Algebra II
- CST Biology
- CST Chemistry
- CST Earth Science
- CST English-Language Arts
- CST General Mathematics
- CST Geometry
- CST Integrated/Coordinated Science
- CST Physics
- CST Science
- CST Summative High School Math
- CST U.S. History
- CST World History
AYP Results (2010)
Overall AYP Met: No
ELA AYP Met: No
Math AYP Met: No
Program Improvement (PI) Requirement Under NCLB (2010)
First Year PI Requirement was Implemented: 1997-1998
School's Placement Under NCLB: Year 5
ACT Exam Results (2009)
Percent of Students Taking ACT Exam: 21.7%
Average Combined Score: 18.9
Percent Scoring At or Above 21: 32.1%
SAT Exam Results (2009)
Percent of Students Taking SAT Exam: 49.9%
Average Combined Score: 1,283.0
Critical Reading Average: 428.9
Math Average: 423.8
Writing Average: 430.3
Percent Scoring At or Above 1500: 19.2%
CST - Test Proficiency by Grade and Subject
Grade 9 - % of students at or above proficiency
| School | District | State | |
|---|---|---|---|
| CST Algebra I Test | |||
| 2010 | 10.0% | 11.0% | 22.0% |
| 2009 | 10.0% | 10.0% | 21.0% |
| 2008 | 3.0% | 9.0% | 18.0% |
| CST Biology Test | |||
| 2010 | 22.0% | 27.0% | 55.0% |
| 2009 | 20.0% | 23.0% | 51.0% |
| 2008 | 28.0% | 25.0% | 52.0% |
| CST English-Language Arts Test | |||
| 2010 | 34.0% | 36.0% | 54.0% |
| 2009 | 32.0% | 32.0% | 50.0% |
| 2008 | 29.0% | 31.0% | 49.0% |
| CST Geometry Test | |||
| 2010 | 13.0% | 21.0% | 46.0% |
| 2009 | 19.0% | 23.0% | 47.0% |
| 2008 | 15.0% | 19.0% | 43.0% |
| CST Integrated/Coordinated Science Test | |||
| 2010 | 3.0% | 13.0% | 19.0% |
| 2009 | 2.0% | 9.0% | 15.0% |
| 2008 | 1.0% | 7.0% | 5.0% |
| CST World History Test | |||
| 2010 | 11.0% | 21.0% | 45.0% |
| 2009 | 9.0% | 18.0% | 41.0% |
| 2008 | 5.0% | 15.0% | 36.0% |
| CST Algebra II Test | |||
| 2009 | 17.0% | 36.0% | 65.0% |
| 2008 | 21.0% | 36.0% | 66.0% |
| CST Chemistry Test | |||
| 2009 | 3.0% | 14.0% | 44.0% |
| CST General Mathematics Test | |||
| 2009 | 7.0% | 13.0% | 17.0% |
Grade 10 - % of students at or above proficiency
| School | District | State | |
|---|---|---|---|
| CST Algebra I Test | |||
| 2010 | 5.0% | 8.0% | 12.0% |
| 2009 | 6.0% | 6.0% | 11.0% |
| 2008 | 1.0% | 5.0% | 9.0% |
| CST Algebra II Test | |||
| 2010 | 11.0% | 21.0% | 40.0% |
| 2009 | 11.0% | 18.0% | 37.0% |
| 2008 | 5.0% | 17.0% | 36.0% |
| CST Biology Test | |||
| 2010 | 14.0% | 29.0% | 38.0% |
| 2009 | 14.0% | 24.0% | 34.0% |
| 2008 | 14.0% | 23.0% | 35.0% |
| CST Chemistry Test | |||
| 2010 | 21.0% | 17.0% | 47.0% |
| 2009 | 16.0% | 15.0% | 44.0% |
| 2008 | 3.0% | 13.0% | 41.0% |
| CST English-Language Arts Test | |||
| 2010 | 35.0% | 33.0% | 45.0% |
| 2009 | 35.0% | 31.0% | 44.0% |
| 2008 | 25.0% | 29.0% | 41.0% |
| CST Geometry Test | |||
| 2010 | 2.0% | 6.0% | 14.0% |
| 2009 | 5.0% | 6.0% | 14.0% |
| 2008 | 2.0% | 5.0% | 12.0% |
| CST Science Test | |||
| 2010 | 28.0% | 32.0% | 46.0% |
| 2009 | 33.0% | 30.0% | 44.0% |
| 2008 | 19.0% | 25.0% | 40.0% |
| CST Summative High School Math Test | |||
| 2010 | 58.0% | 53.0% | 75.0% |
| 2009 | 54.0% | 42.0% | 71.0% |
| CST World History Test | |||
| 2010 | 39.0% | 28.0% | 42.0% |
| 2009 | 34.0% | 24.0% | 38.0% |
| 2008 | 20.0% | 19.0% | 33.0% |
Grade 11 - % of students at or above proficiency
| School | District | State | |
|---|---|---|---|
| CST Algebra I Test | |||
| 2010 | 6.0% | 6.0% | 8.0% |
| CST Algebra II Test | |||
| 2010 | 3.0% | 6.0% | 14.0% |
| 2009 | 2.0% | 6.0% | 12.0% |
| 2008 | 1.0% | 5.0% | 11.0% |
| CST Biology Test | |||
| 2010 | 36.0% | 29.0% | 46.0% |
| 2009 | 19.0% | 26.0% | 41.0% |
| 2008 | 21.0% | 26.0% | 39.0% |
| CST Chemistry Test | |||
| 2010 | 16.0% | 15.0% | 30.0% |
| 2009 | 7.0% | 13.0% | 27.0% |
| 2008 | 7.0% | 11.0% | 25.0% |
| CST Earth Science Test | |||
| 2010 | 73.0% | 36.0% | 32.0% |
| 2009 | 56.0% | 34.0% | 26.0% |
| 2008 | 39.0% | 29.0% | 28.0% |
| CST English-Language Arts Test | |||
| 2010 | 38.0% | 34.0% | 42.0% |
| 2009 | 29.0% | 32.0% | 40.0% |
| 2008 | 21.0% | 27.0% | 37.0% |
| CST Geometry Test | |||
| 2010 | 1.0% | 3.0% | 6.0% |
| 2009 | - | - | - |
| 2008 | 1.0% | 2.0% | 6.0% |
| CST Physics Test | |||
| 2010 | 17.0% | 26.0% | 53.0% |
| 2009 | 4.0% | 22.0% | 50.0% |
| 2008 | 15.0% | 19.0% | 47.0% |
| CST Summative High School Math Test | |||
| 2010 | 22.0% | 31.0% | 50.0% |
| 2009 | 8.0% | 27.0% | 47.0% |
| 2008 | 10.0% | 25.0% | 43.0% |
| CST U.S. History Test | |||
| 2010 | 37.0% | 33.0% | 45.0% |
| 2009 | 31.0% | 31.0% | 44.0% |
| 2008 | 23.0% | 25.0% | 38.0% |
| CST World History Test | |||
| 2010 | 25.0% | 14.0% | 15.0% |
| 2009 | 13.0% | 8.0% | 11.0% |
| 2008 | 11.0% | 7.0% | 9.0% |
End of Course - % of students at or above proficiency
| School | District | State | |
|---|---|---|---|
| CST Algebra I Test | |||
| 2010 | 10.0% | 22.0% | 31.0% |
| 2009 | 9.0% | 19.0% | 28.0% |
| 2008 | 2.0% | 17.0% | 25.0% |
| CST Algebra II Test | |||
| 2010 | 8.0% | 16.0% | 31.0% |
| 2009 | 7.0% | 15.0% | 28.0% |
| 2008 | 4.0% | 13.0% | 27.0% |
| CST Biology Test | |||
| 2010 | 21.0% | 28.0% | 46.0% |
| 2009 | 18.0% | 24.0% | 42.0% |
| 2008 | 22.0% | 24.0% | 42.0% |
| CST Chemistry Test | |||
| 2010 | 18.0% | 16.0% | 38.0% |
| 2009 | 12.0% | 14.0% | 36.0% |
| 2008 | 5.0% | 12.0% | 32.0% |
| CST Earth Science Test | |||
| 2010 | 67.0% | 30.0% | 33.0% |
| 2009 | 47.0% | 25.0% | 28.0% |
| 2008 | 36.0% | 21.0% | 28.0% |
| CST Geometry Test | |||
| 2010 | 7.0% | 14.0% | 27.0% |
| 2009 | 10.0% | 14.0% | 26.0% |
| 2008 | 6.0% | 11.0% | 24.0% |
| CST Integrated/Coordinated Science Test | |||
| 2010 | 3.0% | 3.0% | 16.0% |
| 2009 | 2.0% | 7.0% | 13.0% |
| 2008 | 1.0% | 2.0% | 11.0% |
| CST Physics Test | |||
| 2010 | 14.0% | 24.0% | 49.0% |
| 2009 | 5.0% | 20.0% | 46.0% |
| 2008 | 14.0% | 18.0% | 43.0% |
| CST Summative High School Math Test | |||
| 2010 | 26.0% | 35.0% | 54.0% |
| 2009 | 13.0% | 30.0% | 50.0% |
| 2008 | 11.0% | 29.0% | 47.0% |
| CST World History Test | |||
| 2010 | 31.0% | 27.0% | 41.0% |
| 2009 | 28.0% | 23.0% | 38.0% |
| 2008 | 16.0% | 18.0% | 33.0% |
| CST General Mathematics Test | |||
| 2009 | 7.0% | 17.0% | 26.0% |
Source: CA Department of Education 2009-2010
School Map and Similar Schools Nearby
Click to Activate Map of Nearby School Campuses
Private
Public
This School
Similar Schools Nearby
| Eagle Rock High School 7-12 | 3,016 Students | 1.3 miles away | Not Yet Rated | |
| Abraham Lincoln High School 9-12 | 2,632 Students | 2.9 miles away | ![]() 5 out of 5 | |
| Woodrow Wilson High School 9-12 | 2,457 Students | 3.2 miles away | Not Yet Rated | |
| John Marshall High School 9-12 | 3,479 Students | 4.5 miles away | ![]() 5 out of 5 | |
| Central La Area New High School #9 9-12 | 1,089 Students | 4.7 miles away | Not Yet Rated | - |
| School for the Visual Arts and Humanities 9-12 | 398 Students | 4.9 miles away | Not Yet Rated | - |
| School of Math and Science 9-12 | 409 Students | 4.9 miles away | Not Yet Rated | - |
| School of Engineering and Technology 9-12 | 403 Students | 4.9 miles away | Not Yet Rated | - |
| Los Angeles Teachers Preparatory Academy 9-12 | 229 Students | 5.2 miles away | Not Yet Rated | - |
| Theodore Roosevelt High School 9-12 | 3,819 Students | 5.3 miles away | ![]() 2.5 out of 5 | |
Compare This School To Nearby Schools ->
School Community Forum

Join a discussion about Benjamin Franklin High School and talk to others in the community including students, parents, teachers, and administrators.
Popular Discussion Topics
- Admissions and Registration Questions (e.g. Dress Code and Discipline Policy)
- School Calendar and Upcoming Events (e.g. Graduation)
- After School Programs, Extracurricular Activities, and Athletics (e.g. Football)
- News and Announcements (e.g. Yearbook and Class Supply List Details)
- Graduate and Alumni Events (e.g. Organizing Class Reunions)
Navigation
Can't Find What You Are Looking For?
Rankings
Sponsored Links
K-12 Articles
Teaching Your Kids About Respect, Values and Violence
These days it seems that every newscast reports at least once incident of violence. As parents, we...
Nothing New Under the Sun
"I had to go through the same thing when I went to school." Every parent has uttered this phrase,...
Teaching Children Respect
Statistics prove that there are many different family types in today's society. Grandparents or a...


