James A. Garfield High School
Rating
Not Available
Not Available

5 out of 5 | 1 Review
Find Old Friends From James A. Garfield High School
Use the form below to search for alumni from James A. Garfield High School.
School Description
School Summary and Highlights
- Enrolls 4,271 high school students from grades 9-12
- Ranks 1091st out of 1,197 high schools in CA.
- 2010 Overall School AYP Met Status: No
Additional Contact Information
- Mailing Address: 5101 East Sixth St., Los Angeles, CA 90022
School Operational Details
- Title I EligibleAll students of this school are eligible for participation in authorized programs.
School District Details
- Los Angeles Unified School District
- Per-Pupil Spending: $11,357
- Graduation Rate: 48.8%
- Dropout Rate: 6.8%
- Students Per Teacher: 21.3
- Enrolled Students: 667,870
Faculty Details and Student Enrollment
Students and Faculty
- Total Students Enrolled: 4,271
- Total Full Time "Equivalent" Teachers: 200.3
- Average Student-To-Teacher Ratio: 21.3
Students Gender Breakdown
- Males: 2,170 (50.8%)
- Females: 2,101 (49.2%)
Free Lunch Student Eligibility Breakdown
- Eligible for Reduced Lunch: 120 (2.8%)
- Eligible for Free Lunch: 3,658 (85.6%)
- Eligible for Either Reduced or Free Lunch: 3,778 (88.5%)
Student Enrollment Distribution by Race / Ethnicity
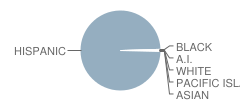
| Number | Percent | |
|---|---|---|
| American Indian | 8 | 0.2% |
| Black | 8 | 0.2% |
| Asian | 8 | 0.2% |
| Hispanic | 4,232 | 99.1% |
| White | 12 | 0.3% |
Number of Students Per Grade
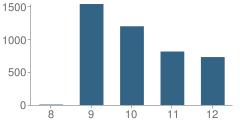
| Number | Percent | |
|---|---|---|
| 8th Grade | 7 | 0.2% |
| 9th Grade | 1,532 | 35.9% |
| 10th Grade | 1,194 | 28.0% |
| 11th Grade | 811 | 19.0% |
| 12th Grade | 727 | 17.0% |
Graduates Information (2010)
Graduation Rate
School:
81.9%
District:
69.1%
State:
78.6%
Teacher Education Background (2009)
Percent With Master's Degree
School:
9.7%
District:
26.9%
Percent With Bachelor's Degree
School:
15.8%
District:
31.9%
Percent With Ph.D.
School:
1.2%
District:
3.7%
Teacher Credentials & Experience (2009)
Average Age
School:
42.0
District:
46.7
Average Number of Years of Teacher Experience: 12.9
Number of Certificated Staff: 247.0
Percent of Teachers With Credentials: 97.7%
Percent of Teachers With Emergency Credentials: 0.9%
Source: CA Department of Education, Source: NCES 2009-2010
School Ratings and Reviews
Overall Rating: 5

5 out of 5 | 1 Review
The Overall Rating is the school's average rating from parents, students, school faculty and staff. The highest rating is five apples and the lowest is one apple.
Share Your Review About This School
1 review for James A. Garfield High School
- Reviewed by Former Student on August 31, 2007
- Rating:
 (5 / 5) Flag as inappropriate
 - this school is full of excellent hard working students who even thought the odds are against them in such ways like financially, racially,legally and other, they've manage to accomplish what many without this problems have not.
School Map and Similar Schools Nearby
Click to Activate Map of Nearby School Campuses
Private
Public
This School
Similar Schools Nearby
| Schurr High School 9-12 | 3,548 Students | 1.9 miles away |  5 out of 5 | |
| Montebello High School 9-12 | 3,491 Students | 2.1 miles away |  4.5 out of 5 | |
| Theodore Roosevelt High School 9-12 | 3,819 Students | 3.2 miles away | Not Yet Rated | |
| Maywood Academy High 9-12 | 1,343 Students | 3.4 miles away | 5 out of 5 | |
| Bell Gardens High School 9-12 | 3,570 Students | 3.4 miles away | Not Yet Rated | |
| Woodrow Wilson High School 9-12 | 2,457 Students | 3.5 miles away | Not Yet Rated | |
| Bell High School 9-12 | 4,301 Students | 4.0 miles away | 4.5 out of 5 | |
| Abraham Lincoln High School 9-12 | 2,632 Students | 4.3 miles away | Not Yet Rated | |
| School of Engineering and Technology 9-12 | 403 Students | 4.3 miles away | Not Yet Rated | - |
| School of Math and Science 9-12 | 409 Students | 4.3 miles away | Not Yet Rated | - |
Compare This School To Nearby Schools ->
School Community Forum

Join a discussion about James A. Garfield High School and talk to others in the community including students, parents, teachers, and administrators.
Popular Discussion Topics
- Admissions and Registration Questions (e.g. Dress Code and Discipline Policy)
- School Calendar and Upcoming Events (e.g. Graduation)
- After School Programs, Extracurricular Activities, and Athletics (e.g. Football)
- News and Announcements (e.g. Yearbook and Class Supply List Details)
- Graduate and Alumni Events (e.g. Organizing Class Reunions)
Navigation
Can't Find What You Are Looking For?
Rankings
Nearby Cities
Sponsored Links
K-12 Articles

Attend Your Teen's Holiday Parties
Christmas and New Years are coming, and with them Christmas and New Years Eve parties. At many of...
Christmas and New Years are coming, and with them Christmas and New Years Eve parties. At many of...

The Impact on Adopted Children at School
Children who are adopted can be affected both academically and socially at school. Many times...
Children who are adopted can be affected both academically and socially at school. Many times...

Changing Schools Isn't Easy: Tips for a Successful Transition
It isn’t easy for students to make the transition into a new school, especially if they have...
It isn’t easy for students to make the transition into a new school, especially if they have...