Samuel Gompers Middle School
Rating
Not Available
Not Available

No Reviews Yet
Find Old Friends From Samuel Gompers Middle School
Use the form below to search for alumni from Samuel Gompers Middle School.
School Description
School Summary and Highlights
- Enrolls 1,449 middle school students from grades 6-8
- Ranks 2021st out of 2,050 middle schools in CA.
- 2010 Overall School AYP Met Status: No
Additional Contact Information
- Mailing Address: 234 East 112th St., Los Angeles, CA 90061
School Operational Details
- Title I EligibleAll students of this school are eligible for participation in authorized programs.
School District Details
- Los Angeles Unified School District
- Per-Pupil Spending: $11,357
- Graduation Rate: 48.8%
- Dropout Rate: 6.8%
- Students Per Teacher: 21.3
- Enrolled Students: 667,870
Faculty Details and Student Enrollment
Students and Faculty
- Total Students Enrolled: 1,449
- Total Full Time "Equivalent" Teachers: 75.0
- Average Student-To-Teacher Ratio: 19.3
Students Gender Breakdown
- Males: 759 (52.4%)
- Females: 690 (47.6%)
Free Lunch Student Eligibility Breakdown
- Eligible for Reduced Lunch: 3 (0.2%)
- Eligible for Free Lunch: 1,121 (77.4%)
- Eligible for Either Reduced or Free Lunch: 1,124 (77.6%)
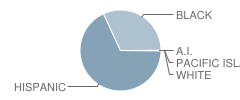
Student Enrollment Distribution by Race / Ethnicity
| Number | Percent | |
|---|---|---|
| American Indian | 2 | 0.1% |
| Black | 461 | 31.8% |
| Asian | - | - |
| Hispanic | 983 | 67.8% |
| White | 1 | 0.07% |
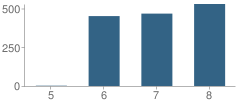
Number of Students Per Grade
| Number | Percent | |
|---|---|---|
| 5th Grade | 2 | 0.1% |
| 6th Grade | 451 | 31.1% |
| 7th Grade | 467 | 32.2% |
| 8th Grade | 529 | 36.5% |
Teacher Education Background (2009)
Percent With Master's Degree
School:
18.1%
District:
26.9%
Percent With Bachelor's Degree
School:
40.4%
District:
31.9%
Teacher Credentials & Experience (2009)
Percent of Teachers With Credentials: 90.8%
Number of Certificated Staff: 94.0
Average Number of Years of Teacher Experience: 5.0
Average Age
School:
35.5
District:
46.7
Source: CA Department of Education, Source: NCES 2009-2010
School Ratings and Reviews
Be The First To Review Samuel Gompers Middle School!
School Map and Similar Schools Nearby
Click to Activate Map of Nearby School Campuses
Private
Public
This School
Similar Schools Nearby
| Bret Harte Preparatory Intermediate School 6-8 | 1,221 Students | 1.4 miles away |  2 out of 5 | |
| Vanguard Learning Center School 4-8 | 407 Students | 1.6 miles away |  5 out of 5 | |
| Avalon Gardens Elementary School KG-6 | 218 Students | 1.9 miles away | Not Yet Rated | |
| Henry Clay Middle School 6-8 | 1,141 Students | 1.9 miles away | Not Yet Rated | |
| Edwin Markham Middle School 6-8 | 1,263 Students | 2.0 miles away | Not Yet Rated | |
| Thurgood Marshall School KG-12 | 14 Students | 2.4 miles away | 5 out of 5 | - |
| Willowbrook Middle School 6-8 | 439 Students | 2.5 miles away |  4.5 out of 5 | |
| Charles Drew Middle School 6-8 | 1,938 Students | 2.6 miles away | Not Yet Rated | |
| Enterprise Middle School 6-8 | 603 Students | 2.8 miles away | 5 out of 5 | |
| Albert F. Monroe Middle School 6-8 | 904 Students | 2.9 miles away | Not Yet Rated | |
Compare This School To Nearby Schools ->
School Community Forum

Join a discussion about Samuel Gompers Middle School and talk to others in the community including students, parents, teachers, and administrators.
Popular Discussion Topics
- Admissions and Registration Questions (e.g. Dress Code and Discipline Policy)
- School Calendar and Upcoming Events (e.g. Graduation)
- After School Programs, Extracurricular Activities, and Athletics (e.g. Football)
- News and Announcements (e.g. Yearbook and Class Supply List Details)
- Graduate and Alumni Events (e.g. Organizing Class Reunions)
Navigation
Can't Find What You Are Looking For?
Rankings
Nearby Cities
Sponsored Links
K-12 Articles

Halloween Safety Tips
Ghosts and witches sit beside mistletoe and tinsel on store shelves. Orange and black deck the...
Ghosts and witches sit beside mistletoe and tinsel on store shelves. Orange and black deck the...

Attend Your Teen's Holiday Parties
Christmas and New Years are coming, and with them Christmas and New Years Eve parties. At many of...
Christmas and New Years are coming, and with them Christmas and New Years Eve parties. At many of...

Does Your Child's Teacher Make a Difference
School improvement is always in the news. Teachers demand smaller class sizes. The government calls...
School improvement is always in the news. Teachers demand smaller class sizes. The government calls...